Immigrants from Eastern Africa vs Salvadoran Median Family Income
COMPARE
Immigrants from Eastern Africa
Salvadoran
Median Family Income
Median Family Income Comparison
Immigrants from Eastern Africa
Salvadorans
$102,451
MEDIAN FAMILY INCOME
47.1/ 100
METRIC RATING
175th/ 347
METRIC RANK
$94,109
MEDIAN FAMILY INCOME
1.2/ 100
METRIC RATING
239th/ 347
METRIC RANK
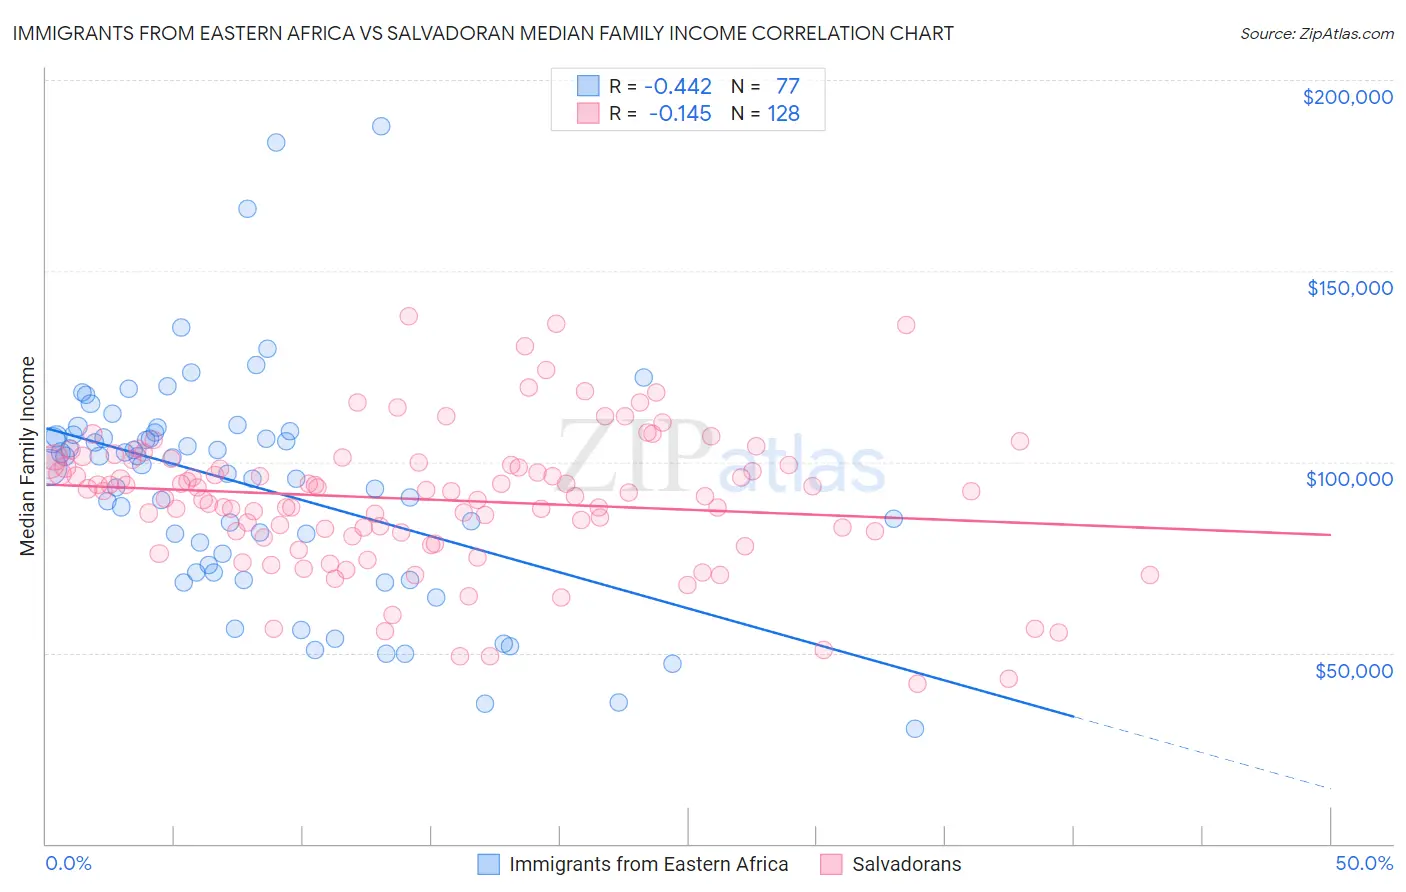
Immigrants from Eastern Africa vs Salvadoran Median Family Income Correlation Chart
The statistical analysis conducted on geographies consisting of 354,805,172 people shows a moderate negative correlation between the proportion of Immigrants from Eastern Africa and median family income in the United States with a correlation coefficient (R) of -0.442 and weighted average of $102,451. Similarly, the statistical analysis conducted on geographies consisting of 398,577,694 people shows a poor negative correlation between the proportion of Salvadorans and median family income in the United States with a correlation coefficient (R) of -0.145 and weighted average of $94,109, a difference of 8.9%.
Median Family Income Correlation Summary
| Measurement | Immigrants from Eastern Africa | Salvadoran |
| Minimum | $29,978 | $41,966 |
| Maximum | $188,047 | $138,117 |
| Range | $158,069 | $96,151 |
| Mean | $93,590 | $90,099 |
| Median | $99,122 | $92,329 |
| Interquartile 25% (IQ1) | $71,998 | $81,022 |
| Interquartile 75% (IQ3) | $107,333 | $99,847 |
| Interquartile Range (IQR) | $35,335 | $18,825 |
| Standard Deviation (Sample) | $29,714 | $18,212 |
| Standard Deviation (Population) | $29,520 | $18,141 |
Similar Demographics by Median Family Income
Demographics Similar to Immigrants from Eastern Africa by Median Family Income
In terms of median family income, the demographic groups most similar to Immigrants from Eastern Africa are French ($102,368, a difference of 0.080%), German ($102,254, a difference of 0.19%), Finnish ($102,676, a difference of 0.22%), Welsh ($102,151, a difference of 0.29%), and Belgian ($102,788, a difference of 0.33%).
| Demographics | Rating | Rank | Median Family Income |
| Immigrants | Peru | 60.8 /100 | #168 | Good $103,534 |
| Czechoslovakians | 57.6 /100 | #169 | Average $103,273 |
| Immigrants | Uzbekistan | 56.6 /100 | #170 | Average $103,197 |
| Alsatians | 54.3 /100 | #171 | Average $103,010 |
| Immigrants | Eritrea | 51.9 /100 | #172 | Average $102,823 |
| Belgians | 51.4 /100 | #173 | Average $102,788 |
| Finns | 50.0 /100 | #174 | Average $102,676 |
| Immigrants | Eastern Africa | 47.1 /100 | #175 | Average $102,451 |
| French | 46.1 /100 | #176 | Average $102,368 |
| Germans | 44.6 /100 | #177 | Average $102,254 |
| Welsh | 43.3 /100 | #178 | Average $102,151 |
| South Americans | 39.7 /100 | #179 | Fair $101,856 |
| French Canadians | 37.0 /100 | #180 | Fair $101,634 |
| Spaniards | 36.8 /100 | #181 | Fair $101,617 |
| Tsimshian | 35.9 /100 | #182 | Fair $101,543 |
Demographics Similar to Salvadorans by Median Family Income
In terms of median family income, the demographic groups most similar to Salvadorans are Somali ($94,085, a difference of 0.030%), Nepalese ($94,153, a difference of 0.050%), Immigrants from Trinidad and Tobago ($93,988, a difference of 0.13%), Barbadian ($93,919, a difference of 0.20%), and German Russian ($93,858, a difference of 0.27%).
| Demographics | Rating | Rank | Median Family Income |
| Immigrants | Venezuela | 1.9 /100 | #232 | Tragic $94,904 |
| Immigrants | Bangladesh | 1.6 /100 | #233 | Tragic $94,665 |
| Immigrants | Western Africa | 1.6 /100 | #234 | Tragic $94,638 |
| Immigrants | Burma/Myanmar | 1.5 /100 | #235 | Tragic $94,472 |
| Trinidadians and Tobagonians | 1.5 /100 | #236 | Tragic $94,466 |
| Alaskan Athabascans | 1.5 /100 | #237 | Tragic $94,429 |
| Nepalese | 1.3 /100 | #238 | Tragic $94,153 |
| Salvadorans | 1.2 /100 | #239 | Tragic $94,109 |
| Somalis | 1.2 /100 | #240 | Tragic $94,085 |
| Immigrants | Trinidad and Tobago | 1.2 /100 | #241 | Tragic $93,988 |
| Barbadians | 1.1 /100 | #242 | Tragic $93,919 |
| German Russians | 1.1 /100 | #243 | Tragic $93,858 |
| Sub-Saharan Africans | 1.0 /100 | #244 | Tragic $93,748 |
| Immigrants | Middle Africa | 1.0 /100 | #245 | Tragic $93,593 |
| Guyanese | 0.9 /100 | #246 | Tragic $93,373 |