Immigrants from Zimbabwe vs Immigrants from Brazil Median Male Earnings
COMPARE
Immigrants from Zimbabwe
Immigrants from Brazil
Median Male Earnings
Median Male Earnings Comparison
Immigrants from Zimbabwe
Immigrants from Brazil
$57,352
MEDIAN MALE EARNINGS
94.3/ 100
METRIC RATING
117th/ 347
METRIC RANK
$58,324
MEDIAN MALE EARNINGS
97.7/ 100
METRIC RATING
101st/ 347
METRIC RANK
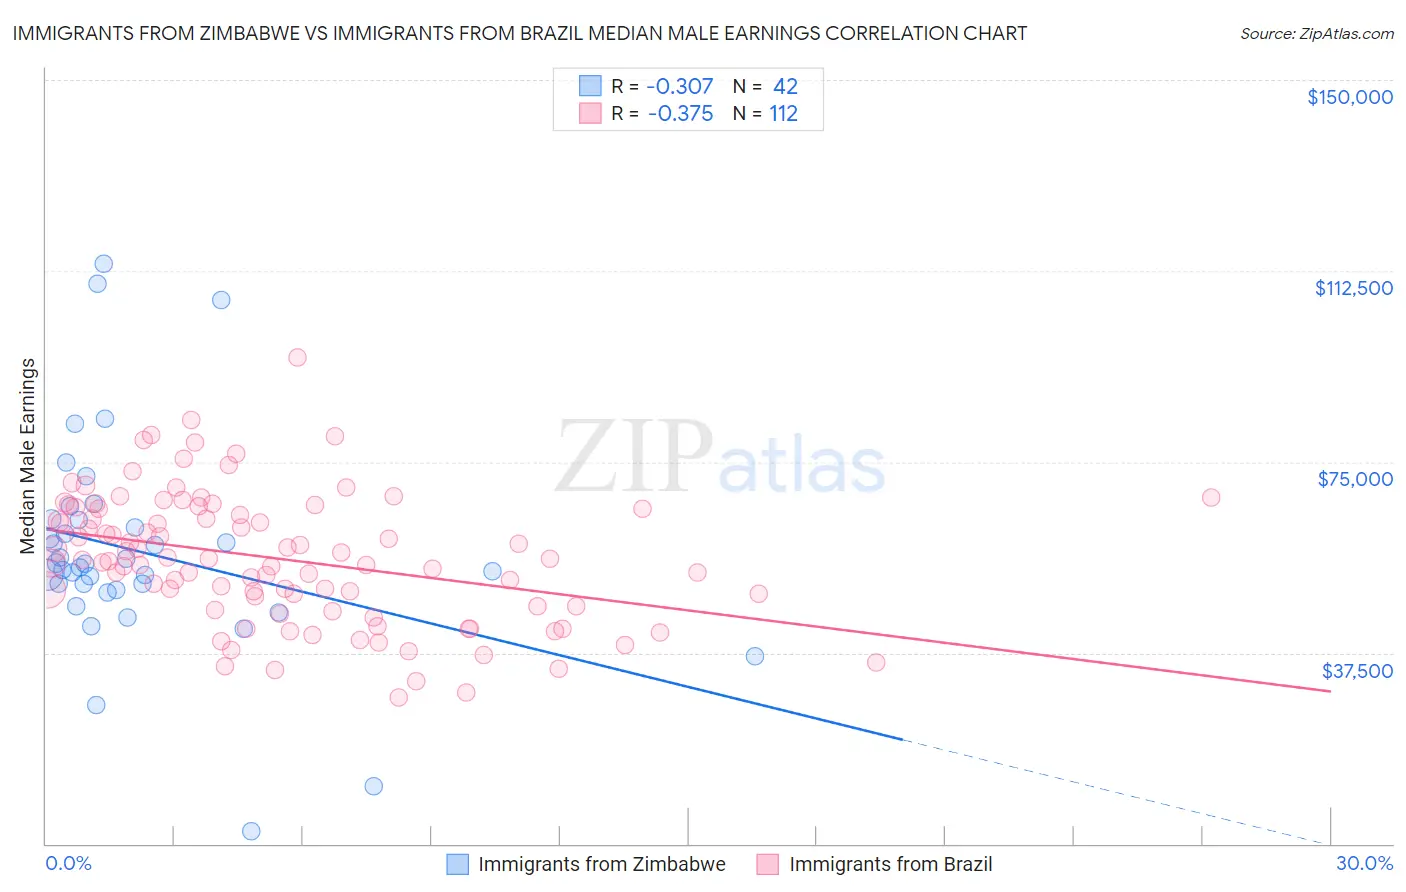
Immigrants from Zimbabwe vs Immigrants from Brazil Median Male Earnings Correlation Chart
The statistical analysis conducted on geographies consisting of 117,801,711 people shows a mild negative correlation between the proportion of Immigrants from Zimbabwe and median male earnings in the United States with a correlation coefficient (R) of -0.307 and weighted average of $57,352. Similarly, the statistical analysis conducted on geographies consisting of 342,925,188 people shows a mild negative correlation between the proportion of Immigrants from Brazil and median male earnings in the United States with a correlation coefficient (R) of -0.375 and weighted average of $58,324, a difference of 1.7%.
Median Male Earnings Correlation Summary
| Measurement | Immigrants from Zimbabwe | Immigrants from Brazil |
| Minimum | $2,499 | $28,750 |
| Maximum | $113,981 | $95,391 |
| Range | $111,482 | $66,641 |
| Mean | $57,395 | $55,921 |
| Median | $54,601 | $55,594 |
| Interquartile 25% (IQ1) | $49,751 | $46,610 |
| Interquartile 75% (IQ3) | $63,542 | $65,884 |
| Interquartile Range (IQR) | $13,791 | $19,274 |
| Standard Deviation (Sample) | $21,107 | $12,788 |
| Standard Deviation (Population) | $20,855 | $12,730 |
Demographics Similar to Immigrants from Zimbabwe and Immigrants from Brazil by Median Male Earnings
In terms of median male earnings, the demographic groups most similar to Immigrants from Zimbabwe are Hungarian ($57,309, a difference of 0.080%), Arab ($57,298, a difference of 0.090%), Lebanese ($57,409, a difference of 0.10%), Swedish ($57,445, a difference of 0.16%), and Immigrants from Kuwait ($57,562, a difference of 0.37%). Similarly, the demographic groups most similar to Immigrants from Brazil are Assyrian/Chaldean/Syriac ($58,437, a difference of 0.19%), Immigrants from Poland ($58,452, a difference of 0.22%), Syrian ($58,187, a difference of 0.24%), Polish ($58,139, a difference of 0.32%), and Armenian ($58,134, a difference of 0.33%).
| Demographics | Rating | Rank | Median Male Earnings |
| Immigrants | Poland | 98.0 /100 | #99 | Exceptional $58,452 |
| Assyrians/Chaldeans/Syriacs | 97.9 /100 | #100 | Exceptional $58,437 |
| Immigrants | Brazil | 97.7 /100 | #101 | Exceptional $58,324 |
| Syrians | 97.4 /100 | #102 | Exceptional $58,187 |
| Poles | 97.3 /100 | #103 | Exceptional $58,139 |
| Armenians | 97.3 /100 | #104 | Exceptional $58,134 |
| Immigrants | Western Asia | 97.3 /100 | #105 | Exceptional $58,131 |
| Immigrants | Northern Africa | 96.9 /100 | #106 | Exceptional $58,008 |
| Serbians | 96.8 /100 | #107 | Exceptional $57,975 |
| Immigrants | Uzbekistan | 96.7 /100 | #108 | Exceptional $57,941 |
| British | 96.5 /100 | #109 | Exceptional $57,890 |
| Palestinians | 96.2 /100 | #110 | Exceptional $57,778 |
| Europeans | 95.6 /100 | #111 | Exceptional $57,637 |
| Immigrants | Afghanistan | 95.4 /100 | #112 | Exceptional $57,582 |
| Carpatho Rusyns | 95.3 /100 | #113 | Exceptional $57,572 |
| Immigrants | Kuwait | 95.3 /100 | #114 | Exceptional $57,562 |
| Swedes | 94.8 /100 | #115 | Exceptional $57,445 |
| Lebanese | 94.6 /100 | #116 | Exceptional $57,409 |
| Immigrants | Zimbabwe | 94.3 /100 | #117 | Exceptional $57,352 |
| Hungarians | 94.0 /100 | #118 | Exceptional $57,309 |
| Arabs | 94.0 /100 | #119 | Exceptional $57,298 |