Immigrants from West Indies vs Tlingit-Haida Median Female Earnings
COMPARE
Immigrants from West Indies
Tlingit-Haida
Median Female Earnings
Median Female Earnings Comparison
Immigrants from West Indies
Tlingit-Haida
$39,441
MEDIAN FEMALE EARNINGS
36.9/ 100
METRIC RATING
185th/ 347
METRIC RANK
$39,513
MEDIAN FEMALE EARNINGS
40.5/ 100
METRIC RATING
182nd/ 347
METRIC RANK
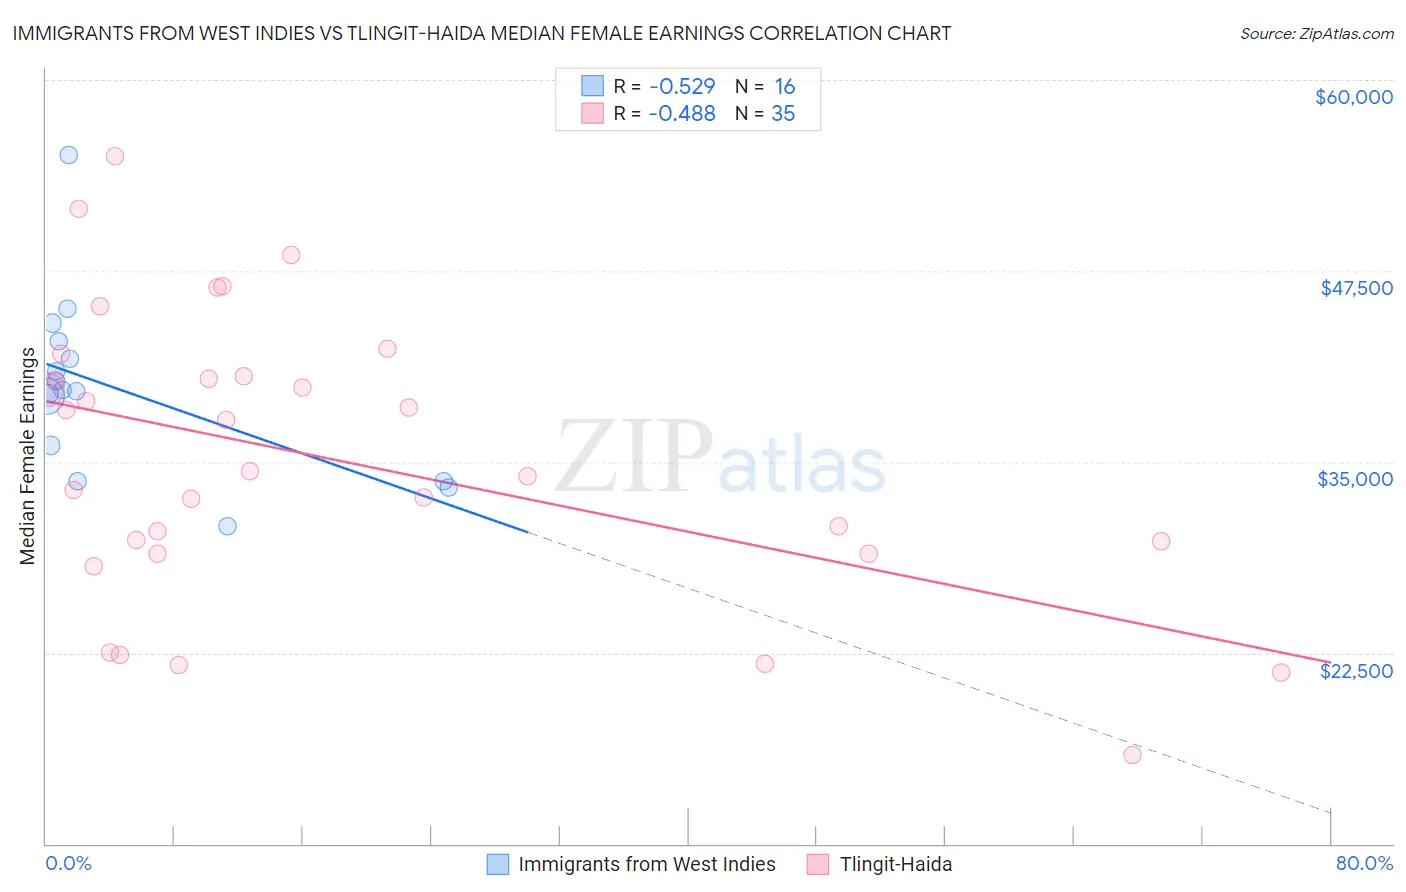
Immigrants from West Indies vs Tlingit-Haida Median Female Earnings Correlation Chart
The statistical analysis conducted on geographies consisting of 72,414,276 people shows a substantial negative correlation between the proportion of Immigrants from West Indies and median female earnings in the United States with a correlation coefficient (R) of -0.529 and weighted average of $39,441. Similarly, the statistical analysis conducted on geographies consisting of 60,850,593 people shows a moderate negative correlation between the proportion of Tlingit-Haida and median female earnings in the United States with a correlation coefficient (R) of -0.488 and weighted average of $39,513, a difference of 0.18%.
Median Female Earnings Correlation Summary
| Measurement | Immigrants from West Indies | Tlingit-Haida |
| Minimum | $30,781 | $15,833 |
| Maximum | $55,116 | $55,000 |
| Range | $24,335 | $39,167 |
| Mean | $39,738 | $35,190 |
| Median | $39,670 | $34,397 |
| Interquartile 25% (IQ1) | $34,901 | $28,977 |
| Interquartile 75% (IQ3) | $42,316 | $40,590 |
| Interquartile Range (IQR) | $7,415 | $11,613 |
| Standard Deviation (Sample) | $5,811 | $9,336 |
| Standard Deviation (Population) | $5,627 | $9,202 |
Demographics Similar to Immigrants from West Indies and Tlingit-Haida by Median Female Earnings
In terms of median female earnings, the demographic groups most similar to Immigrants from West Indies are Colombian ($39,439, a difference of 0.0%), European ($39,457, a difference of 0.040%), Swedish ($39,421, a difference of 0.050%), Bermudan ($39,418, a difference of 0.060%), and Senegalese ($39,384, a difference of 0.14%). Similarly, the demographic groups most similar to Tlingit-Haida are Hungarian ($39,510, a difference of 0.010%), Tsimshian ($39,530, a difference of 0.050%), Immigrants from Kenya ($39,535, a difference of 0.060%), European ($39,457, a difference of 0.14%), and Colombian ($39,439, a difference of 0.19%).
| Demographics | Rating | Rank | Median Female Earnings |
| Canadians | 51.4 /100 | #173 | Average $39,724 |
| South Americans | 50.0 /100 | #174 | Average $39,698 |
| Immigrants | South America | 47.2 /100 | #175 | Average $39,643 |
| Nigerians | 47.0 /100 | #176 | Average $39,641 |
| Costa Ricans | 46.1 /100 | #177 | Average $39,622 |
| Slavs | 45.6 /100 | #178 | Average $39,613 |
| Immigrants | Germany | 45.1 /100 | #179 | Average $39,603 |
| Immigrants | Kenya | 41.6 /100 | #180 | Average $39,535 |
| Tsimshian | 41.4 /100 | #181 | Average $39,530 |
| Tlingit-Haida | 40.5 /100 | #182 | Average $39,513 |
| Hungarians | 40.3 /100 | #183 | Average $39,510 |
| Europeans | 37.7 /100 | #184 | Fair $39,457 |
| Immigrants | West Indies | 36.9 /100 | #185 | Fair $39,441 |
| Colombians | 36.9 /100 | #186 | Fair $39,439 |
| Swedes | 36.0 /100 | #187 | Fair $39,421 |
| Bermudans | 35.9 /100 | #188 | Fair $39,418 |
| Senegalese | 34.2 /100 | #189 | Fair $39,384 |
| Puget Sound Salish | 33.9 /100 | #190 | Fair $39,376 |
| Immigrants | Western Africa | 32.7 /100 | #191 | Fair $39,351 |
| Immigrants | Immigrants | 31.7 /100 | #192 | Fair $39,328 |
| Immigrants | Nigeria | 30.2 /100 | #193 | Fair $39,294 |