Immigrants from West Indies vs Tlingit-Haida Average Family Size
COMPARE
Immigrants from West Indies
Tlingit-Haida
Average Family Size
Average Family Size Comparison
Immigrants from West Indies
Tlingit-Haida
3.33
AVERAGE FAMILY SIZE
99.9/ 100
METRIC RATING
71st/ 347
METRIC RANK
3.16
AVERAGE FAMILY SIZE
0.7/ 100
METRIC RATING
270th/ 347
METRIC RANK
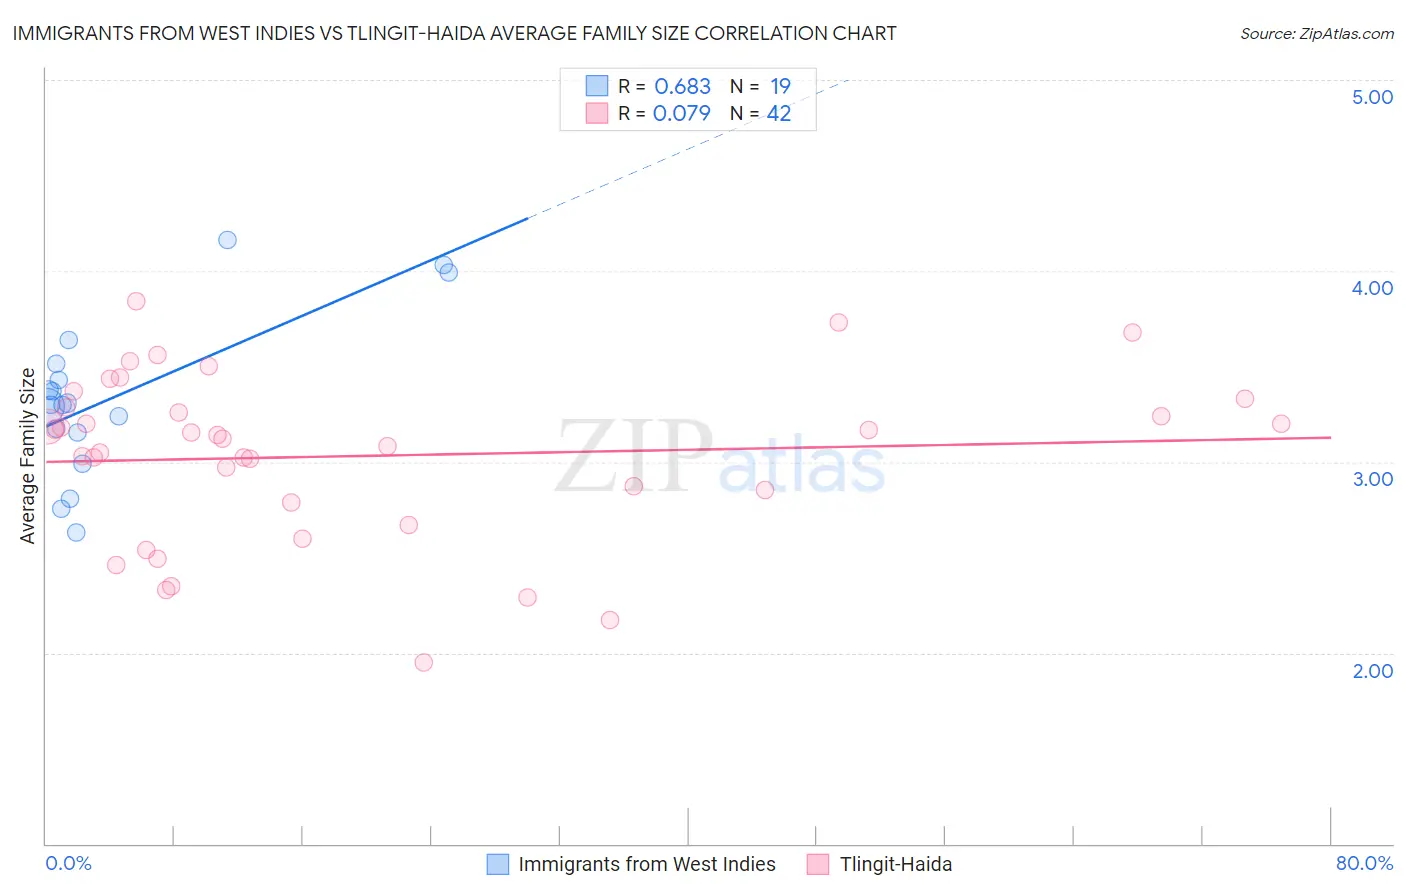
Immigrants from West Indies vs Tlingit-Haida Average Family Size Correlation Chart
The statistical analysis conducted on geographies consisting of 72,454,628 people shows a significant positive correlation between the proportion of Immigrants from West Indies and average family size in the United States with a correlation coefficient (R) of 0.683 and weighted average of 3.33. Similarly, the statistical analysis conducted on geographies consisting of 60,855,605 people shows a slight positive correlation between the proportion of Tlingit-Haida and average family size in the United States with a correlation coefficient (R) of 0.079 and weighted average of 3.16, a difference of 5.5%.
Average Family Size Correlation Summary
| Measurement | Immigrants from West Indies | Tlingit-Haida |
| Minimum | 2.63 | 1.95 |
| Maximum | 4.16 | 3.84 |
| Range | 1.53 | 1.89 |
| Mean | 3.34 | 3.03 |
| Median | 3.30 | 3.13 |
| Interquartile 25% (IQ1) | 3.15 | 2.79 |
| Interquartile 75% (IQ3) | 3.51 | 3.29 |
| Interquartile Range (IQR) | 0.36 | 0.50 |
| Standard Deviation (Sample) | 0.41 | 0.44 |
| Standard Deviation (Population) | 0.40 | 0.43 |
Similar Demographics by Average Family Size
Demographics Similar to Immigrants from West Indies by Average Family Size
In terms of average family size, the demographic groups most similar to Immigrants from West Indies are Immigrants from Trinidad and Tobago (3.33, a difference of 0.010%), Immigrants (3.33, a difference of 0.060%), Immigrants from Caribbean (3.33, a difference of 0.070%), Immigrants from Cambodia (3.33, a difference of 0.090%), and Yaqui (3.32, a difference of 0.10%).
| Demographics | Rating | Rank | Average Family Size |
| Dominicans | 99.9 /100 | #64 | Exceptional 3.34 |
| Immigrants | Laos | 99.9 /100 | #65 | Exceptional 3.34 |
| Immigrants | St. Vincent and the Grenadines | 99.9 /100 | #66 | Exceptional 3.34 |
| Immigrants | Jamaica | 99.9 /100 | #67 | Exceptional 3.33 |
| Immigrants | Cambodia | 99.9 /100 | #68 | Exceptional 3.33 |
| Immigrants | Immigrants | 99.9 /100 | #69 | Exceptional 3.33 |
| Immigrants | Trinidad and Tobago | 99.9 /100 | #70 | Exceptional 3.33 |
| Immigrants | West Indies | 99.9 /100 | #71 | Exceptional 3.33 |
| Immigrants | Caribbean | 99.9 /100 | #72 | Exceptional 3.33 |
| Yaqui | 99.9 /100 | #73 | Exceptional 3.32 |
| Immigrants | Sierra Leone | 99.9 /100 | #74 | Exceptional 3.32 |
| Immigrants | Barbados | 99.8 /100 | #75 | Exceptional 3.32 |
| Trinidadians and Tobagonians | 99.8 /100 | #76 | Exceptional 3.32 |
| Immigrants | Ecuador | 99.8 /100 | #77 | Exceptional 3.32 |
| Immigrants | Micronesia | 99.8 /100 | #78 | Exceptional 3.32 |
Demographics Similar to Tlingit-Haida by Average Family Size
In terms of average family size, the demographic groups most similar to Tlingit-Haida are Immigrants from Germany (3.15, a difference of 0.020%), Immigrants from Singapore (3.16, a difference of 0.030%), Maltese (3.16, a difference of 0.040%), Immigrants from Lithuania (3.15, a difference of 0.040%), and New Zealander (3.15, a difference of 0.060%).
| Demographics | Rating | Rank | Average Family Size |
| Immigrants | Bulgaria | 1.0 /100 | #263 | Tragic 3.16 |
| Americans | 1.0 /100 | #264 | Tragic 3.16 |
| Immigrants | South Africa | 0.9 /100 | #265 | Tragic 3.16 |
| Immigrants | Greece | 0.9 /100 | #266 | Tragic 3.16 |
| Iroquois | 0.8 /100 | #267 | Tragic 3.16 |
| Maltese | 0.8 /100 | #268 | Tragic 3.16 |
| Immigrants | Singapore | 0.7 /100 | #269 | Tragic 3.16 |
| Tlingit-Haida | 0.7 /100 | #270 | Tragic 3.16 |
| Immigrants | Germany | 0.7 /100 | #271 | Tragic 3.15 |
| Immigrants | Lithuania | 0.6 /100 | #272 | Tragic 3.15 |
| New Zealanders | 0.6 /100 | #273 | Tragic 3.15 |
| Immigrants | Belgium | 0.6 /100 | #274 | Tragic 3.15 |
| Cambodians | 0.6 /100 | #275 | Tragic 3.15 |
| Immigrants | Bosnia and Herzegovina | 0.5 /100 | #276 | Tragic 3.15 |
| Swiss | 0.5 /100 | #277 | Tragic 3.15 |