Immigrants from West Indies vs Immigrants from Nepal Divorced or Separated

COMPARE

Immigrants from West Indies
Race
Ancestry
AfghanAfricanAlaska NativeAlaskan AthabascanAlbanianAleutAlsatianAmericanApacheArabArapahoArgentineanArmenianAssyrian/Chaldean/SyriacAustralianAustrianBahamianBangladeshiBarbadianBasqueBelgianBelizeanBermudanBhutaneseBlackfeetBolivianBrazilianBritishBritish West IndianBulgarianBurmeseCajunCambodianCanadianCape VerdeanCarpatho RusynCelticCentral AmericanCentral American IndianCherokeeCheyenneChickasawChileanChineseChippewaChoctawColombianColvilleComancheCosta RicanCreeCreekCroatianCrowCubanCypriotCzechCzechoslovakianDanishDelawareDominicanDutchDutch West IndianEastern EuropeanEcuadorianEgyptianEnglishEstonianEthiopianEuropeanFijianFilipinoFinnishFrenchFrench American IndianFrench CanadianGermanGerman RussianGhanaianGreekGuamanian/ChamorroGuatemalanGuyaneseHaitianHmongHonduranHopiHoumaHungarianIcelanderIndian (Asian)IndonesianInupiatIranianIraqiIrishIroquoisIsraeliItalianJamaicanJapaneseJordanianKenyanKiowaKoreanLaotianLatvianLebaneseLiberianLithuanianLumbeeLuxembourgerMacedonianMalaysianMalteseMarshalleseMenomineeMexicanMexican American IndianMongolianMoroccanNative HawaiianNavajoNepaleseNew ZealanderNicaraguanNigerianNorthern EuropeanNorwegianOkinawanOsageOttawaPaiutePakistaniPalestinianPanamanianParaguayanPennsylvania GermanPeruvianPimaPolishPortuguesePotawatomiPuebloPuerto RicanPuget Sound SalishRomanianRussianSalvadoranSamoanScandinavianScotch-IrishScottishSeminoleSenegaleseSerbianShoshoneSierra LeoneanSiouxSlavicSlovakSloveneSomaliSouth AfricanSouth AmericanSouth American IndianSoviet UnionSpaniardSpanishSpanish AmericanSpanish American IndianSri LankanSubsaharan AfricanSudaneseSwedishSwissSyrianTaiwaneseThaiTlingit-HaidaTohono O'OdhamTonganTrinidadian and TobagonianTsimshianTurkishU.S. Virgin IslanderUgandanUkrainianUruguayanUteVenezuelanVietnameseWelshWest IndianYakamaYaquiYugoslavianYumanYup'ikZimbabwean
Immigration
NonimmigrantsImmigrantsAfghanistanAfricaAlbaniaArgentinaArmeniaAsiaAustraliaAustriaBahamasBangladeshBarbadosBelarusBelgiumBelizeBoliviaBosnia and HerzegovinaBrazilBulgariaBurma/MyanmarCabo VerdeCambodiaCameroonCanadaCaribbeanCentral AmericaChileChinaColombiaCongoCosta RicaCroatiaCubaCzechoslovakiaDenmarkDominicaDominican RepublicEastern AfricaEastern AsiaEastern EuropeEcuadorEgyptEl SalvadorEnglandEritreaEthiopiaEuropeFijiFranceGermanyGhanaGreeceGrenadaGuatemalaGuyanaHaitiHondurasHong KongHungaryIndiaIndonesiaIranIraqIrelandIsraelItalyJamaicaJapanJordanKazakhstanKenyaKoreaKuwaitLaosLatin AmericaLatviaLebanonLiberiaLithuaniaMalaysiaMexicoMicronesiaMiddle AfricaMoldovaMoroccoNetherlandsNicaraguaNigeriaNorth AmericaNorth MacedoniaNorthern AfricaNorthern EuropeNorwayOceaniaPakistanPanamaPeruPhilippinesPolandPortugalRomaniaRussiaSaudi ArabiaScotlandSenegalSerbiaSierra LeoneSingaporeSomaliaSouth AfricaSouth AmericaSouth Central AsiaSouth Eastern AsiaSouthern EuropeSpainSri LankaSt. Vincent and the GrenadinesSudanSwedenSwitzerlandSyriaTaiwanThailandTrinidad and TobagoTurkeyUgandaUkraineUruguayUzbekistanVenezuelaVietnamWest IndiesWestern AfricaWestern AsiaWestern EuropeYemenZaireZimbabweAzores
Immigrants from Nepal
Race
Ancestry
AfghanAfricanAlaska NativeAlaskan AthabascanAlbanianAleutAlsatianAmericanApacheArabArapahoArgentineanArmenianAssyrian/Chaldean/SyriacAustralianAustrianBahamianBangladeshiBarbadianBasqueBelgianBelizeanBermudanBhutaneseBlackfeetBolivianBrazilianBritishBritish West IndianBulgarianBurmeseCajunCambodianCanadianCape VerdeanCarpatho RusynCelticCentral AmericanCentral American IndianCherokeeCheyenneChickasawChileanChineseChippewaChoctawColombianColvilleComancheCosta RicanCreeCreekCroatianCrowCubanCypriotCzechCzechoslovakianDanishDelawareDominicanDutchDutch West IndianEastern EuropeanEcuadorianEgyptianEnglishEstonianEthiopianEuropeanFijianFilipinoFinnishFrenchFrench American IndianFrench CanadianGermanGerman RussianGhanaianGreekGuamanian/ChamorroGuatemalanGuyaneseHaitianHmongHonduranHopiHoumaHungarianIcelanderIndian (Asian)IndonesianInupiatIranianIraqiIrishIroquoisIsraeliItalianJamaicanJapaneseJordanianKenyanKiowaKoreanLaotianLatvianLebaneseLiberianLithuanianLumbeeLuxembourgerMacedonianMalaysianMalteseMarshalleseMenomineeMexicanMexican American IndianMongolianMoroccanNative HawaiianNavajoNepaleseNew ZealanderNicaraguanNigerianNorthern EuropeanNorwegianOkinawanOsageOttawaPaiutePakistaniPalestinianPanamanianParaguayanPennsylvania GermanPeruvianPimaPolishPortuguesePotawatomiPuebloPuerto RicanPuget Sound SalishRomanianRussianSalvadoranSamoanScandinavianScotch-IrishScottishSeminoleSenegaleseSerbianShoshoneSierra LeoneanSiouxSlavicSlovakSloveneSomaliSouth AfricanSouth AmericanSouth American IndianSoviet UnionSpaniardSpanishSpanish AmericanSpanish American IndianSri LankanSubsaharan AfricanSudaneseSwedishSwissSyrianTaiwaneseThaiTlingit-HaidaTohono O'OdhamTonganTrinidadian and TobagonianTsimshianTurkishU.S. Virgin IslanderUgandanUkrainianUruguayanUteVenezuelanVietnameseWelshWest IndianYakamaYaquiYugoslavianYumanYup'ikZimbabwean
Immigration
NonimmigrantsImmigrantsAfghanistanAfricaAlbaniaArgentinaArmeniaAsiaAustraliaAustriaBahamasBangladeshBarbadosBelarusBelgiumBelizeBoliviaBosnia and HerzegovinaBrazilBulgariaBurma/MyanmarCabo VerdeCambodiaCameroonCanadaCaribbeanCentral AmericaChileChinaColombiaCongoCosta RicaCroatiaCubaCzechoslovakiaDenmarkDominicaDominican RepublicEastern AfricaEastern AsiaEastern EuropeEcuadorEgyptEl SalvadorEnglandEritreaEthiopiaEuropeFijiFranceGermanyGhanaGreeceGrenadaGuatemalaGuyanaHaitiHondurasHong KongHungaryIndiaIndonesiaIranIraqIrelandIsraelItalyJamaicaJapanJordanKazakhstanKenyaKoreaKuwaitLaosLatin AmericaLatviaLebanonLiberiaLithuaniaMalaysiaMexicoMicronesiaMiddle AfricaMoldovaMoroccoNepalNetherlandsNicaraguaNigeriaNorth AmericaNorth MacedoniaNorthern AfricaNorthern EuropeNorwayOceaniaPakistanPanamaPeruPhilippinesPolandPortugalRomaniaRussiaSaudi ArabiaScotlandSenegalSerbiaSierra LeoneSingaporeSomaliaSouth AfricaSouth AmericaSouth Central AsiaSouth Eastern AsiaSouthern EuropeSpainSri LankaSt. Vincent and the GrenadinesSudanSwedenSwitzerlandSyriaTaiwanThailandTrinidad and TobagoTurkeyUgandaUkraineUruguayUzbekistanVenezuelaVietnamWestern AfricaWestern AsiaWestern EuropeYemenZaireZimbabweAzores
Divorced or Separated
Income
Poverty
Unemployment
Labor Participation
Family Structure
Vehicle Availability
Education Level
Disability

Divorced or Separated Comparison

Immigrants from West Indies

Immigrants from Nepal

Tragic
Exceptional
12.5%
DIVORCED OR SEPARATED
1.9/ 100
METRIC RATING
246th/ 347
METRIC RANK
11.6%
DIVORCED OR SEPARATED
99.2/ 100
METRIC RATING
87th/ 347
METRIC RANK

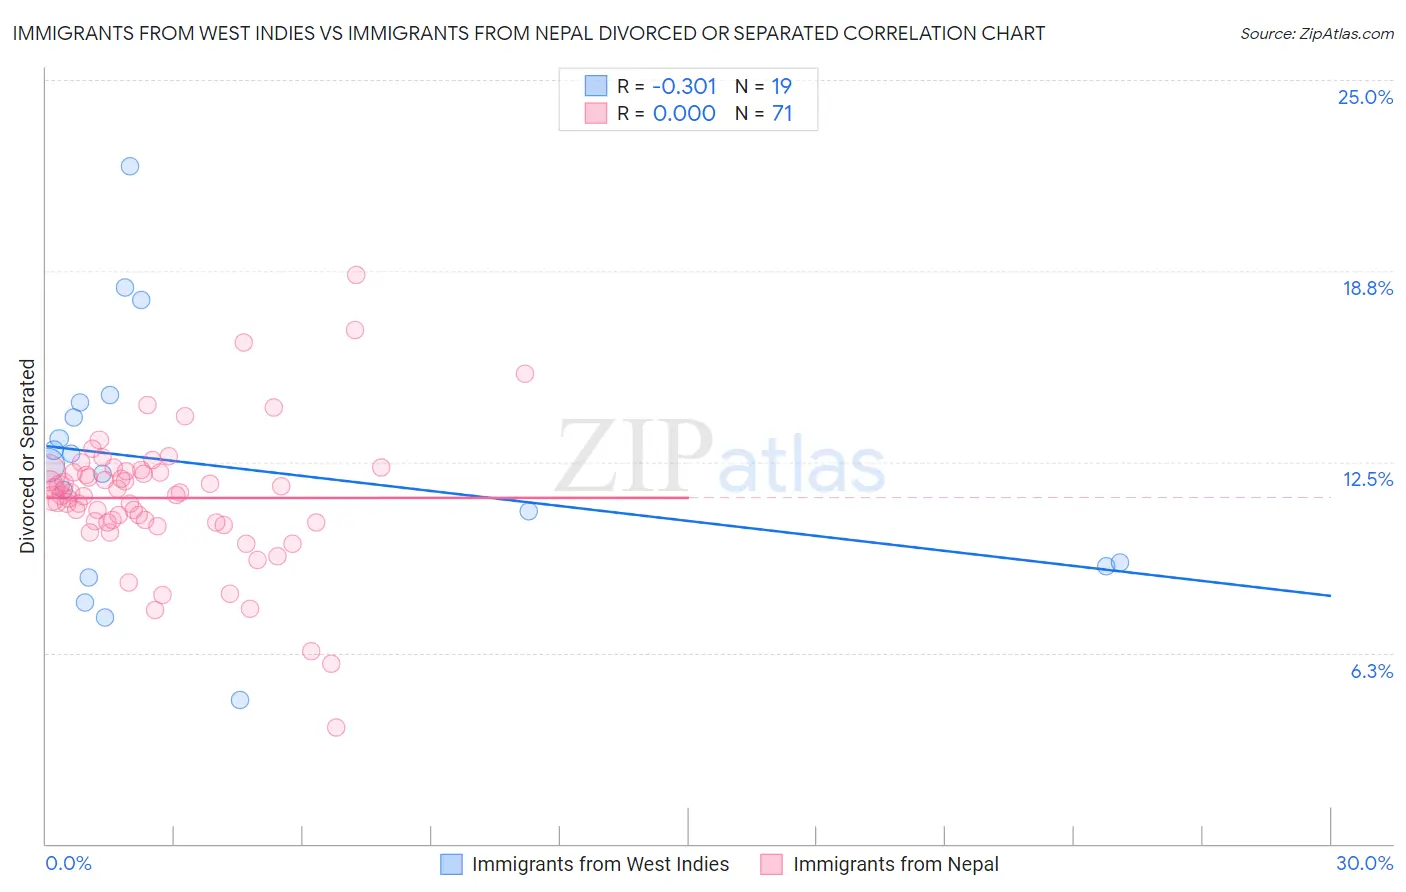
Immigrants from West Indies vs Immigrants from Nepal Divorced or Separated Correlation Chart

The statistical analysis conducted on geographies consisting of 72,457,514 people shows a mild negative correlation between the proportion of Immigrants from West Indies and percentage of population currently divorced or separated in the United States with a correlation coefficient (R) of -0.301 and weighted average of 12.5%. Similarly, the statistical analysis conducted on geographies consisting of 186,713,204 people shows no correlation between the proportion of Immigrants from Nepal and percentage of population currently divorced or separated in the United States with a correlation coefficient (R) of 0.000 and weighted average of 11.6%, a difference of 7.9%.
Immigrants from West Indies vs Immigrants from Nepal Divorced or Separated

Divorced or Separated Correlation Summary

MeasurementImmigrants from West IndiesImmigrants from Nepal
Minimum4.7%3.8%
Maximum22.2%18.6%
Range17.5%14.8%
Mean12.3%11.3%
Median12.4%11.4%
Interquartile 25% (IQ1)9.1%10.5%
Interquartile 75% (IQ3)14.5%12.2%
Interquartile Range (IQR)5.4%1.7%
Standard Deviation (Sample)4.2%2.3%
Standard Deviation (Population)4.1%2.3%

Similar Demographics by Divorced or Separated

Demographics Similar to Immigrants from West Indies by Divorced or Separated

In terms of divorced or separated, the demographic groups most similar to Immigrants from West Indies are Hispanic or Latino (12.5%, a difference of 0.020%), German (12.5%, a difference of 0.030%), Nepalese (12.5%, a difference of 0.060%), Finnish (12.5%, a difference of 0.070%), and Alaska Native (12.4%, a difference of 0.24%).
DemographicsRating | RankDivorced or Separated
Immigrants | Germany
4.0
/100
|
#239
Tragic
12.4%
British West Indians
3.7
/100
|
#240
Tragic
12.4%
Uruguayans
3.4
/100
|
#241
Tragic
12.4%
Dutch
3.1
/100
|
#242
Tragic
12.4%
Immigrants | Latin America
2.8
/100
|
#243
Tragic
12.4%
Alaska Natives
2.5
/100
|
#244
Tragic
12.4%
Hispanics or Latinos
2.0
/100
|
#245
Tragic
12.5%
Immigrants | West Indies
1.9
/100
|
#246
Tragic
12.5%
Germans
1.8
/100
|
#247
Tragic
12.5%
Nepalese
1.8
/100
|
#248
Tragic
12.5%
Finns
1.8
/100
|
#249
Tragic
12.5%
Irish
1.3
/100
|
#250
Tragic
12.5%
Aleuts
1.3
/100
|
#251
Tragic
12.5%
Liberians
0.9
/100
|
#252
Tragic
12.6%
Somalis
0.9
/100
|
#253
Tragic
12.6%

Demographics Similar to Immigrants from Nepal by Divorced or Separated

In terms of divorced or separated, the demographic groups most similar to Immigrants from Nepal are Immigrants from Latvia (11.6%, a difference of 0.030%), Immigrants from Europe (11.6%, a difference of 0.030%), Immigrants from Southern Europe (11.6%, a difference of 0.070%), Immigrants from Albania (11.5%, a difference of 0.10%), and Bulgarian (11.5%, a difference of 0.15%).
DemographicsRating | RankDivorced or Separated
Immigrants | Switzerland
99.4
/100
|
#80
Exceptional
11.5%
Russians
99.4
/100
|
#81
Exceptional
11.5%
Immigrants | Romania
99.3
/100
|
#82
Exceptional
11.5%
Immigrants | Bulgaria
99.3
/100
|
#83
Exceptional
11.5%
Bulgarians
99.3
/100
|
#84
Exceptional
11.5%
Immigrants | Albania
99.3
/100
|
#85
Exceptional
11.5%
Immigrants | Latvia
99.2
/100
|
#86
Exceptional
11.6%
Immigrants | Nepal
99.2
/100
|
#87
Exceptional
11.6%
Immigrants | Europe
99.2
/100
|
#88
Exceptional
11.6%
Immigrants | Southern Europe
99.1
/100
|
#89
Exceptional
11.6%
Zimbabweans
99.0
/100
|
#90
Exceptional
11.6%
Spanish American Indians
99.0
/100
|
#91
Exceptional
11.6%
Immigrants | Denmark
98.9
/100
|
#92
Exceptional
11.6%
Arabs
98.9
/100
|
#93
Exceptional
11.6%
Immigrants | Fiji
98.9
/100
|
#94
Exceptional
11.6%