Immigrants from Venezuela vs Immigrants from Kenya 10th Grade
COMPARE
Immigrants from Venezuela
Immigrants from Kenya
10th Grade
10th Grade Comparison
Immigrants from Venezuela
Immigrants from Kenya
93.8%
10TH GRADE
53.9/ 100
METRIC RATING
170th/ 347
METRIC RANK
94.0%
10TH GRADE
75.3/ 100
METRIC RATING
154th/ 347
METRIC RANK
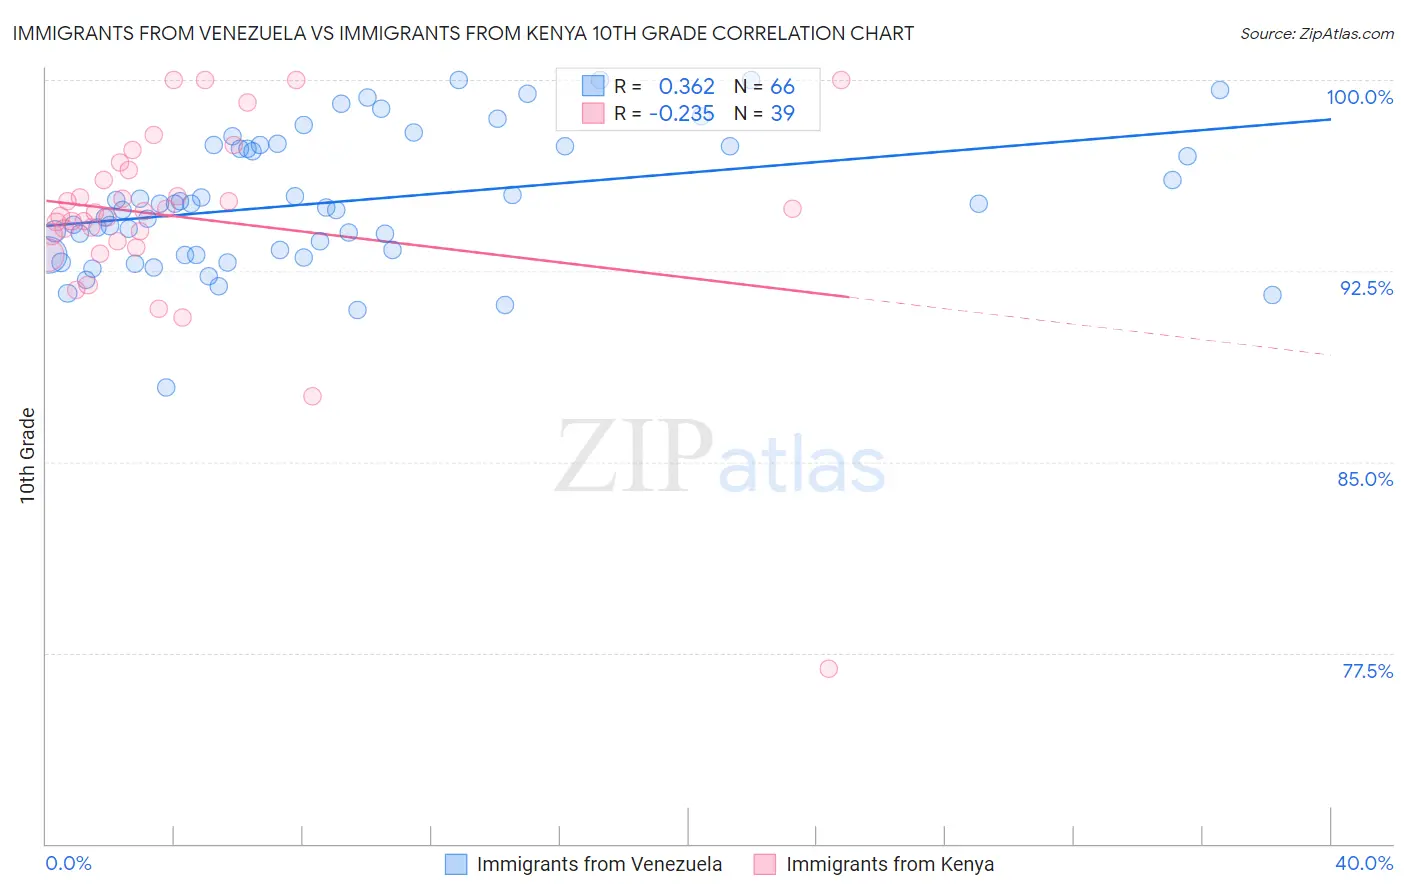
Immigrants from Venezuela vs Immigrants from Kenya 10th Grade Correlation Chart
The statistical analysis conducted on geographies consisting of 287,866,258 people shows a mild positive correlation between the proportion of Immigrants from Venezuela and percentage of population with at least 10th grade education in the United States with a correlation coefficient (R) of 0.362 and weighted average of 93.8%. Similarly, the statistical analysis conducted on geographies consisting of 218,076,690 people shows a weak negative correlation between the proportion of Immigrants from Kenya and percentage of population with at least 10th grade education in the United States with a correlation coefficient (R) of -0.235 and weighted average of 94.0%, a difference of 0.21%.
10th Grade Correlation Summary
| Measurement | Immigrants from Venezuela | Immigrants from Kenya |
| Minimum | 87.9% | 76.9% |
| Maximum | 100.0% | 100.0% |
| Range | 12.1% | 23.1% |
| Mean | 95.2% | 94.6% |
| Median | 95.1% | 94.8% |
| Interquartile 25% (IQ1) | 93.1% | 93.6% |
| Interquartile 75% (IQ3) | 97.4% | 96.4% |
| Interquartile Range (IQR) | 4.3% | 2.8% |
| Standard Deviation (Sample) | 2.6% | 3.9% |
| Standard Deviation (Population) | 2.6% | 3.9% |
Demographics Similar to Immigrants from Venezuela and Immigrants from Kenya by 10th Grade
In terms of 10th grade, the demographic groups most similar to Immigrants from Venezuela are Immigrants from Albania (93.8%, a difference of 0.010%), Immigrants from Spain (93.8%, a difference of 0.020%), French American Indian (93.7%, a difference of 0.030%), Alsatian (93.8%, a difference of 0.050%), and Immigrants from Iraq (93.8%, a difference of 0.080%). Similarly, the demographic groups most similar to Immigrants from Kenya are Immigrants from Brazil (94.0%, a difference of 0.0%), Spanish (94.0%, a difference of 0.0%), Mongolian (94.0%, a difference of 0.010%), Kiowa (93.9%, a difference of 0.020%), and Immigrants from Italy (94.0%, a difference of 0.030%).
| Demographics | Rating | Rank | 10th Grade |
| Immigrants | Italy | 78.0 /100 | #152 | Good 94.0% |
| Immigrants | Brazil | 75.5 /100 | #153 | Good 94.0% |
| Immigrants | Kenya | 75.3 /100 | #154 | Good 94.0% |
| Spanish | 74.9 /100 | #155 | Good 94.0% |
| Mongolians | 74.4 /100 | #156 | Good 94.0% |
| Kiowa | 73.3 /100 | #157 | Good 93.9% |
| Bermudans | 71.0 /100 | #158 | Good 93.9% |
| Chileans | 70.2 /100 | #159 | Good 93.9% |
| Pakistanis | 70.1 /100 | #160 | Good 93.9% |
| Assyrians/Chaldeans/Syriacs | 69.7 /100 | #161 | Good 93.9% |
| Immigrants | Poland | 69.6 /100 | #162 | Good 93.9% |
| Venezuelans | 69.5 /100 | #163 | Good 93.9% |
| Iraqis | 68.1 /100 | #164 | Good 93.9% |
| Brazilians | 63.6 /100 | #165 | Good 93.8% |
| Immigrants | Iraq | 63.0 /100 | #166 | Good 93.8% |
| Immigrants | Egypt | 62.3 /100 | #167 | Good 93.8% |
| Alsatians | 59.4 /100 | #168 | Average 93.8% |
| Immigrants | Spain | 55.9 /100 | #169 | Average 93.8% |
| Immigrants | Venezuela | 53.9 /100 | #170 | Average 93.8% |
| Immigrants | Albania | 52.4 /100 | #171 | Average 93.8% |
| French American Indians | 50.9 /100 | #172 | Average 93.7% |