German vs Comanche Householder Income Ages 45 - 64 years
COMPARE
German
Comanche
Householder Income Ages 45 - 64 years
Householder Income Ages 45 - 64 years Comparison
Germans
Comanche
$100,224
HOUSEHOLDER INCOME AGES 45 - 64 YEARS
48.8/ 100
METRIC RATING
175th/ 347
METRIC RANK
$85,787
HOUSEHOLDER INCOME AGES 45 - 64 YEARS
0.1/ 100
METRIC RATING
293rd/ 347
METRIC RANK
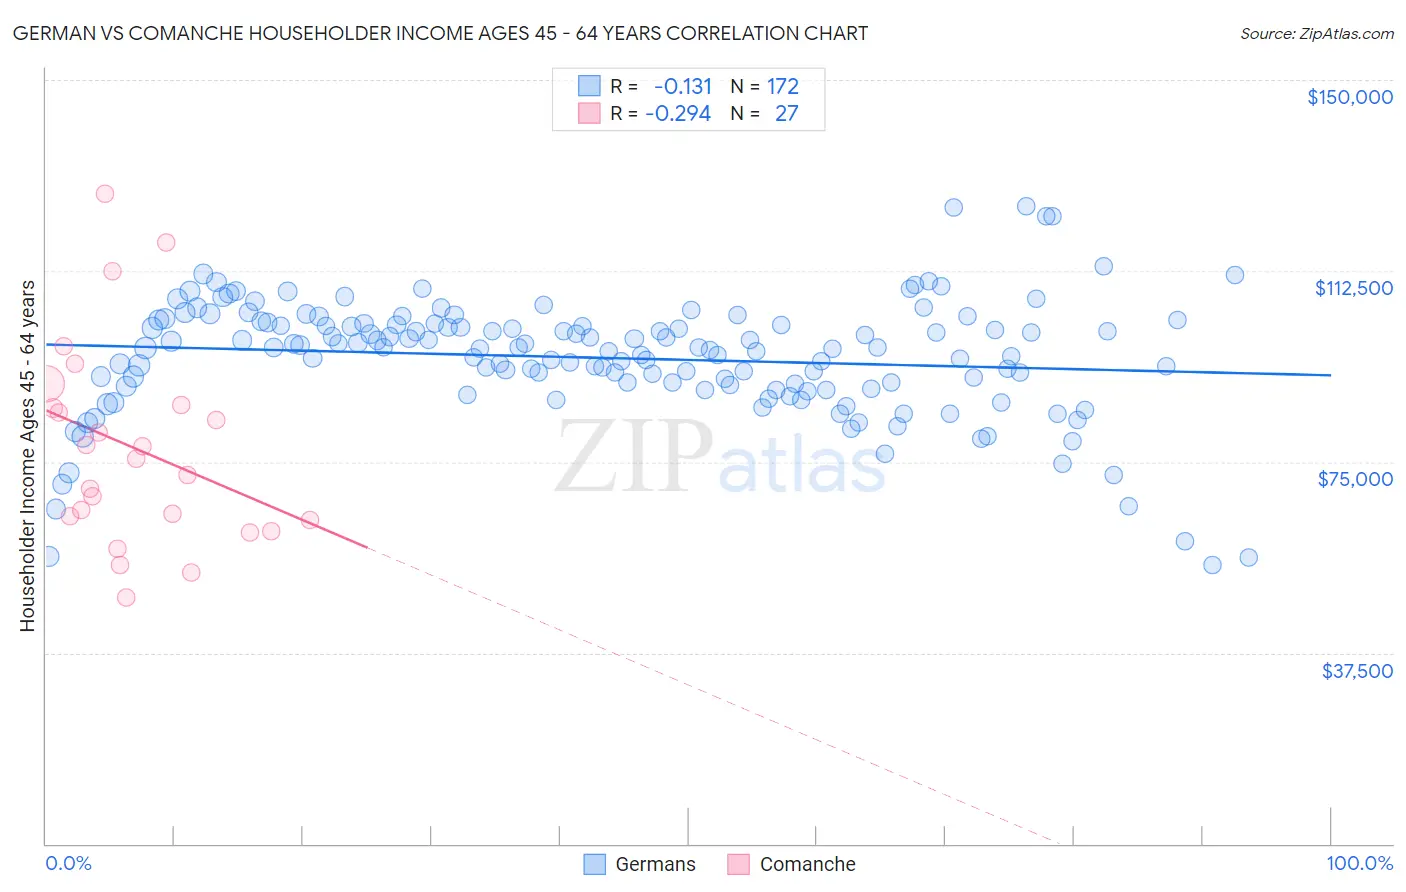
German vs Comanche Householder Income Ages 45 - 64 years Correlation Chart
The statistical analysis conducted on geographies consisting of 575,941,982 people shows a poor negative correlation between the proportion of Germans and household income with householder between the ages 45 and 64 in the United States with a correlation coefficient (R) of -0.131 and weighted average of $100,224. Similarly, the statistical analysis conducted on geographies consisting of 109,696,818 people shows a weak negative correlation between the proportion of Comanche and household income with householder between the ages 45 and 64 in the United States with a correlation coefficient (R) of -0.294 and weighted average of $85,787, a difference of 16.8%.
Householder Income Ages 45 - 64 years Correlation Summary
| Measurement | German | Comanche |
| Minimum | $54,688 | $48,474 |
| Maximum | $125,293 | $127,559 |
| Range | $70,605 | $79,085 |
| Mean | $95,438 | $77,729 |
| Median | $97,438 | $75,610 |
| Interquartile 25% (IQ1) | $90,029 | $63,523 |
| Interquartile 75% (IQ3) | $102,031 | $86,210 |
| Interquartile Range (IQR) | $12,003 | $22,687 |
| Standard Deviation (Sample) | $11,697 | $19,770 |
| Standard Deviation (Population) | $11,663 | $19,400 |
Similar Demographics by Householder Income Ages 45 - 64 years
Demographics Similar to Germans by Householder Income Ages 45 - 64 years
In terms of householder income ages 45 - 64 years, the demographic groups most similar to Germans are Immigrants from Costa Rica ($100,141, a difference of 0.080%), Moroccan ($100,138, a difference of 0.090%), Welsh ($100,322, a difference of 0.10%), Immigrants from Cameroon ($100,084, a difference of 0.14%), and Belgian ($100,060, a difference of 0.16%).
| Demographics | Rating | Rank | Householder Income Ages 45 - 64 years |
| South American Indians | 60.5 /100 | #168 | Good $101,171 |
| Guamanians/Chamorros | 60.5 /100 | #169 | Good $101,170 |
| Slovaks | 58.8 /100 | #170 | Average $101,029 |
| South Americans | 56.4 /100 | #171 | Average $100,837 |
| Immigrants | Uzbekistan | 52.5 /100 | #172 | Average $100,523 |
| Alsatians | 51.4 /100 | #173 | Average $100,435 |
| Welsh | 50.0 /100 | #174 | Average $100,322 |
| Germans | 48.8 /100 | #175 | Average $100,224 |
| Immigrants | Costa Rica | 47.7 /100 | #176 | Average $100,141 |
| Moroccans | 47.7 /100 | #177 | Average $100,138 |
| Immigrants | Cameroon | 47.0 /100 | #178 | Average $100,084 |
| Belgians | 46.7 /100 | #179 | Average $100,060 |
| Aleuts | 46.6 /100 | #180 | Average $100,052 |
| Immigrants | Immigrants | 45.3 /100 | #181 | Average $99,943 |
| Finns | 44.8 /100 | #182 | Average $99,904 |
Demographics Similar to Comanche by Householder Income Ages 45 - 64 years
In terms of householder income ages 45 - 64 years, the demographic groups most similar to Comanche are Immigrants from Central America ($85,965, a difference of 0.21%), Hispanic or Latino ($86,006, a difference of 0.25%), British West Indian ($85,571, a difference of 0.25%), Immigrants from Grenada ($85,552, a difference of 0.27%), and Cherokee ($86,125, a difference of 0.39%).
| Demographics | Rating | Rank | Householder Income Ages 45 - 64 years |
| Immigrants | Guatemala | 0.1 /100 | #286 | Tragic $86,573 |
| Bangladeshis | 0.1 /100 | #287 | Tragic $86,402 |
| Immigrants | St. Vincent and the Grenadines | 0.1 /100 | #288 | Tragic $86,394 |
| Cubans | 0.1 /100 | #289 | Tragic $86,301 |
| Cherokee | 0.1 /100 | #290 | Tragic $86,125 |
| Hispanics or Latinos | 0.1 /100 | #291 | Tragic $86,006 |
| Immigrants | Central America | 0.1 /100 | #292 | Tragic $85,965 |
| Comanche | 0.1 /100 | #293 | Tragic $85,787 |
| British West Indians | 0.1 /100 | #294 | Tragic $85,571 |
| Immigrants | Grenada | 0.1 /100 | #295 | Tragic $85,552 |
| Immigrants | Zaire | 0.1 /100 | #296 | Tragic $85,207 |
| Fijians | 0.1 /100 | #297 | Tragic $85,187 |
| Africans | 0.0 /100 | #298 | Tragic $84,925 |
| Immigrants | Mexico | 0.0 /100 | #299 | Tragic $84,910 |
| Indonesians | 0.0 /100 | #300 | Tragic $84,890 |