Immigrants from Uruguay vs Sierra Leonean Householder Income Ages 45 - 64 years
COMPARE
Immigrants from Uruguay
Sierra Leonean
Householder Income Ages 45 - 64 years
Householder Income Ages 45 - 64 years Comparison
Immigrants from Uruguay
Sierra Leoneans
$96,086
HOUSEHOLDER INCOME AGES 45 - 64 YEARS
10.7/ 100
METRIC RATING
213th/ 347
METRIC RANK
$102,427
HOUSEHOLDER INCOME AGES 45 - 64 YEARS
74.2/ 100
METRIC RATING
159th/ 347
METRIC RANK
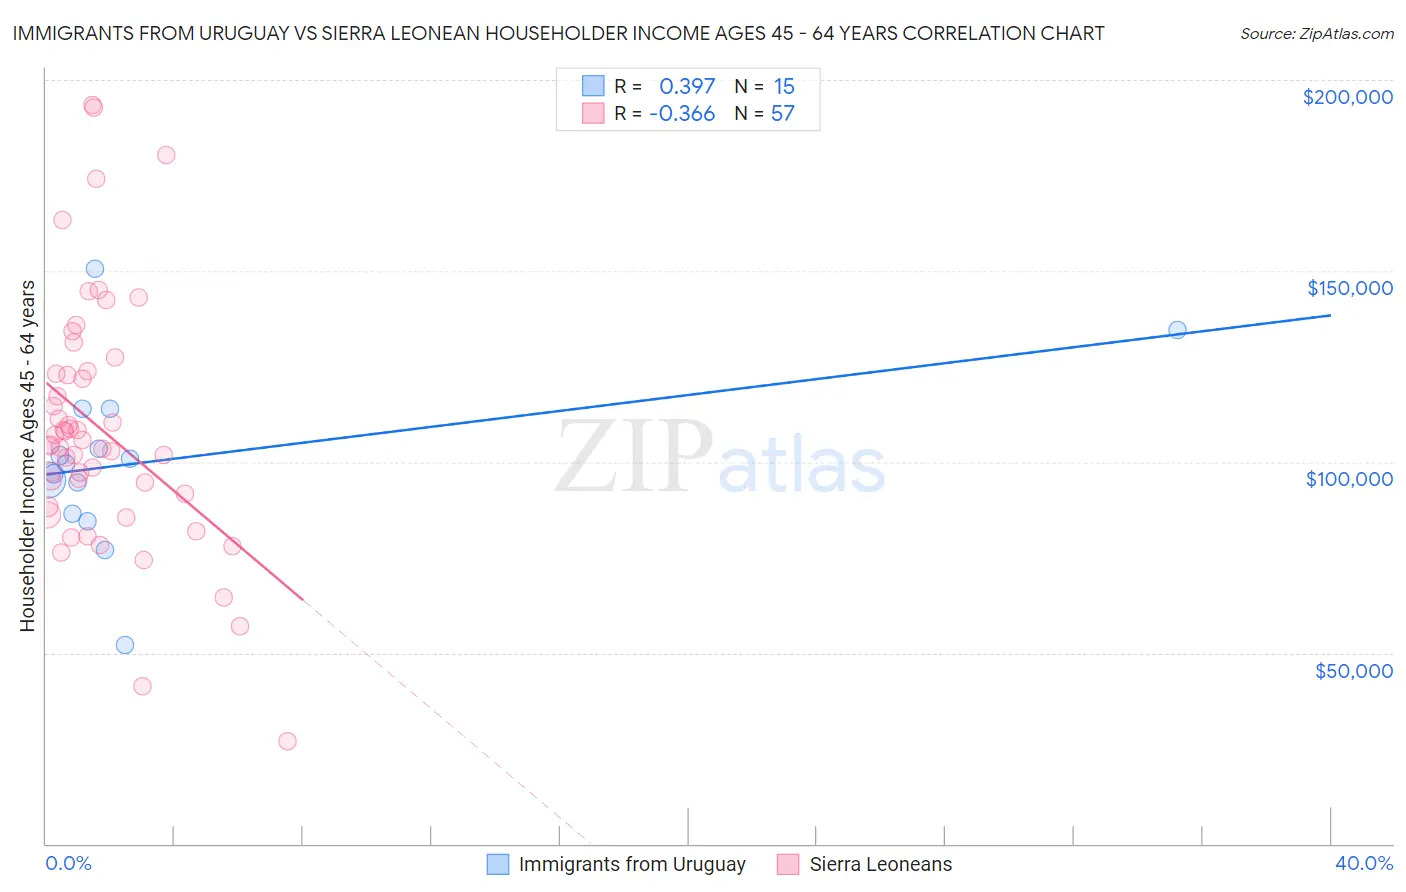
Immigrants from Uruguay vs Sierra Leonean Householder Income Ages 45 - 64 years Correlation Chart
The statistical analysis conducted on geographies consisting of 133,207,341 people shows a mild positive correlation between the proportion of Immigrants from Uruguay and household income with householder between the ages 45 and 64 in the United States with a correlation coefficient (R) of 0.397 and weighted average of $96,086. Similarly, the statistical analysis conducted on geographies consisting of 83,324,243 people shows a mild negative correlation between the proportion of Sierra Leoneans and household income with householder between the ages 45 and 64 in the United States with a correlation coefficient (R) of -0.366 and weighted average of $102,427, a difference of 6.6%.
Householder Income Ages 45 - 64 years Correlation Summary
| Measurement | Immigrants from Uruguay | Sierra Leonean |
| Minimum | $51,929 | $26,764 |
| Maximum | $150,685 | $193,348 |
| Range | $98,756 | $166,584 |
| Mean | $100,358 | $108,787 |
| Median | $99,578 | $104,388 |
| Interquartile 25% (IQ1) | $86,473 | $89,997 |
| Interquartile 75% (IQ3) | $113,852 | $123,470 |
| Interquartile Range (IQR) | $27,380 | $33,473 |
| Standard Deviation (Sample) | $23,140 | $32,726 |
| Standard Deviation (Population) | $22,356 | $32,438 |
Similar Demographics by Householder Income Ages 45 - 64 years
Demographics Similar to Immigrants from Uruguay by Householder Income Ages 45 - 64 years
In terms of householder income ages 45 - 64 years, the demographic groups most similar to Immigrants from Uruguay are Panamanian ($96,066, a difference of 0.020%), Venezuelan ($96,460, a difference of 0.39%), Immigrants from Cambodia ($96,537, a difference of 0.47%), Nigerian ($95,492, a difference of 0.62%), and Tsimshian ($96,783, a difference of 0.73%).
| Demographics | Rating | Rank | Householder Income Ages 45 - 64 years |
| Immigrants | Africa | 17.9 /100 | #206 | Poor $97,284 |
| Ghanaians | 17.9 /100 | #207 | Poor $97,277 |
| Scotch-Irish | 16.4 /100 | #208 | Poor $97,073 |
| Japanese | 14.8 /100 | #209 | Poor $96,834 |
| Tsimshian | 14.5 /100 | #210 | Poor $96,783 |
| Immigrants | Cambodia | 13.0 /100 | #211 | Poor $96,537 |
| Venezuelans | 12.6 /100 | #212 | Poor $96,460 |
| Immigrants | Uruguay | 10.7 /100 | #213 | Poor $96,086 |
| Panamanians | 10.6 /100 | #214 | Poor $96,066 |
| Nigerians | 8.2 /100 | #215 | Tragic $95,492 |
| Immigrants | Venezuela | 7.6 /100 | #216 | Tragic $95,342 |
| Immigrants | Ghana | 6.4 /100 | #217 | Tragic $94,982 |
| Delaware | 6.2 /100 | #218 | Tragic $94,914 |
| Immigrants | Armenia | 6.1 /100 | #219 | Tragic $94,863 |
| Salvadorans | 6.0 /100 | #220 | Tragic $94,842 |
Demographics Similar to Sierra Leoneans by Householder Income Ages 45 - 64 years
In terms of householder income ages 45 - 64 years, the demographic groups most similar to Sierra Leoneans are Icelander ($102,261, a difference of 0.16%), Slavic ($102,629, a difference of 0.20%), Immigrants from Nepal ($102,190, a difference of 0.23%), Scottish ($102,123, a difference of 0.30%), and Immigrants from Ethiopia ($102,763, a difference of 0.33%).
| Demographics | Rating | Rank | Householder Income Ages 45 - 64 years |
| Irish | 79.8 /100 | #152 | Good $103,067 |
| Scandinavians | 79.0 /100 | #153 | Good $102,969 |
| Slovenes | 78.3 /100 | #154 | Good $102,885 |
| Costa Ricans | 77.4 /100 | #155 | Good $102,779 |
| Carpatho Rusyns | 77.4 /100 | #156 | Good $102,777 |
| Immigrants | Ethiopia | 77.3 /100 | #157 | Good $102,763 |
| Slavs | 76.1 /100 | #158 | Good $102,629 |
| Sierra Leoneans | 74.2 /100 | #159 | Good $102,427 |
| Icelanders | 72.5 /100 | #160 | Good $102,261 |
| Immigrants | Nepal | 71.8 /100 | #161 | Good $102,190 |
| Scottish | 71.1 /100 | #162 | Good $102,123 |
| English | 70.1 /100 | #163 | Good $102,021 |
| Immigrants | Morocco | 70.0 /100 | #164 | Good $102,015 |
| Immigrants | Albania | 69.4 /100 | #165 | Good $101,957 |
| Samoans | 65.3 /100 | #166 | Good $101,580 |