Immigrants from Uruguay vs Dutch Per Capita Income
COMPARE
Immigrants from Uruguay
Dutch
Per Capita Income
Per Capita Income Comparison
Immigrants from Uruguay
Dutch
$43,997
PER CAPITA INCOME
59.3/ 100
METRIC RATING
166th/ 347
METRIC RANK
$42,605
PER CAPITA INCOME
23.4/ 100
METRIC RATING
196th/ 347
METRIC RANK
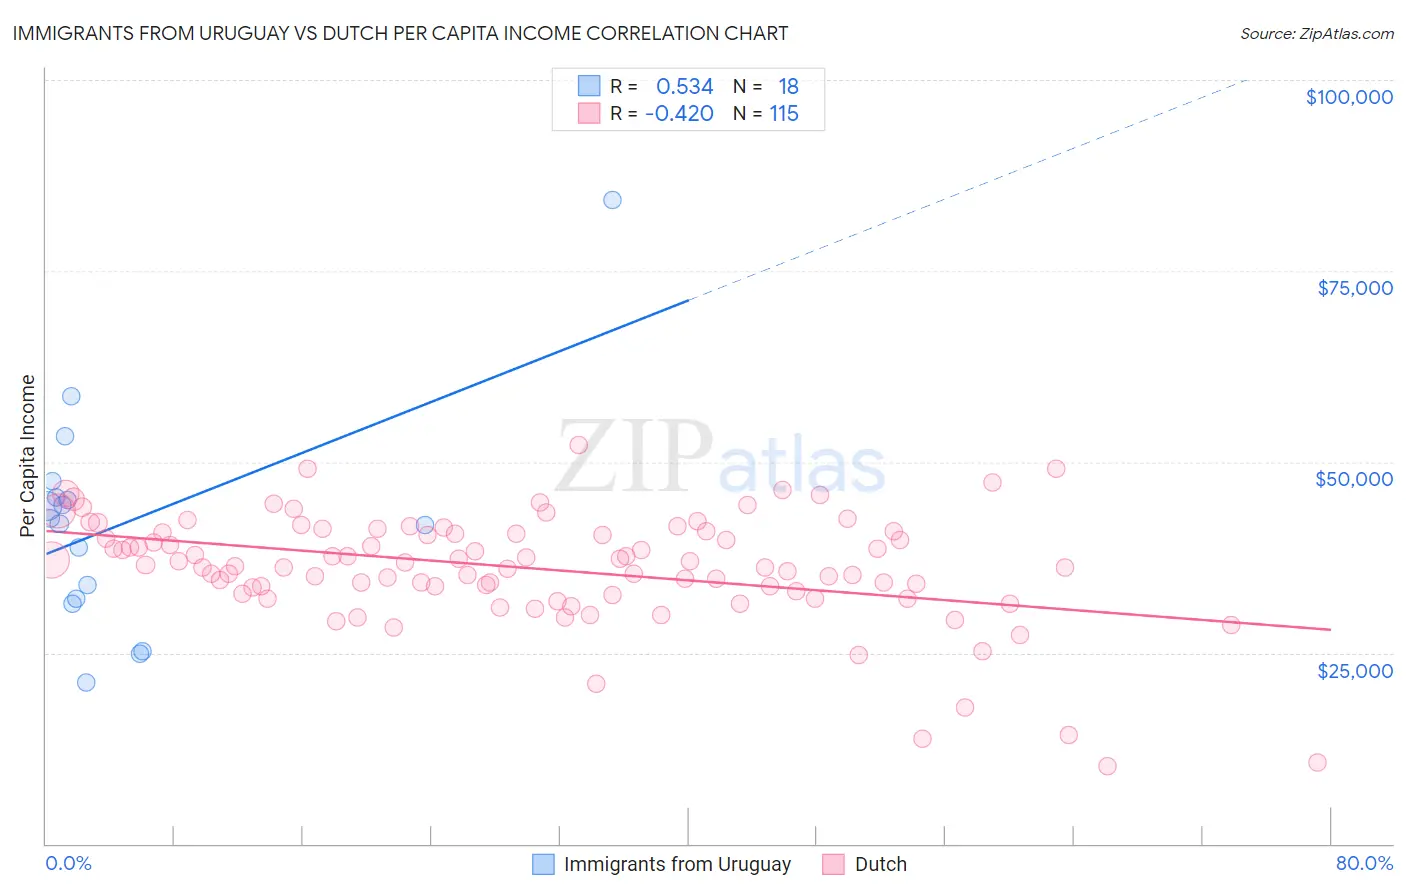
Immigrants from Uruguay vs Dutch Per Capita Income Correlation Chart
The statistical analysis conducted on geographies consisting of 133,259,667 people shows a substantial positive correlation between the proportion of Immigrants from Uruguay and per capita income in the United States with a correlation coefficient (R) of 0.534 and weighted average of $43,997. Similarly, the statistical analysis conducted on geographies consisting of 554,404,949 people shows a moderate negative correlation between the proportion of Dutch and per capita income in the United States with a correlation coefficient (R) of -0.420 and weighted average of $42,605, a difference of 3.3%.
Per Capita Income Correlation Summary
| Measurement | Immigrants from Uruguay | Dutch |
| Minimum | $21,194 | $10,108 |
| Maximum | $84,313 | $52,150 |
| Range | $63,119 | $42,042 |
| Mean | $42,012 | $36,061 |
| Median | $42,230 | $36,441 |
| Interquartile 25% (IQ1) | $32,137 | $33,045 |
| Interquartile 75% (IQ3) | $45,280 | $40,758 |
| Interquartile Range (IQR) | $13,143 | $7,713 |
| Standard Deviation (Sample) | $14,447 | $7,274 |
| Standard Deviation (Population) | $14,040 | $7,242 |
Similar Demographics by Per Capita Income
Demographics Similar to Immigrants from Uruguay by Per Capita Income
In terms of per capita income, the demographic groups most similar to Immigrants from Uruguay are Immigrants from Philippines ($44,000, a difference of 0.010%), English ($43,982, a difference of 0.030%), Sri Lankan ($44,014, a difference of 0.040%), Belgian ($43,951, a difference of 0.10%), and Immigrants from South America ($44,068, a difference of 0.16%).
| Demographics | Rating | Rank | Per Capita Income |
| South Americans | 62.4 /100 | #159 | Good $44,114 |
| Danes | 61.9 /100 | #160 | Good $44,095 |
| Costa Ricans | 61.8 /100 | #161 | Good $44,090 |
| Swiss | 61.4 /100 | #162 | Good $44,076 |
| Immigrants | South America | 61.2 /100 | #163 | Good $44,068 |
| Sri Lankans | 59.8 /100 | #164 | Average $44,014 |
| Immigrants | Philippines | 59.4 /100 | #165 | Average $44,000 |
| Immigrants | Uruguay | 59.3 /100 | #166 | Average $43,997 |
| English | 58.9 /100 | #167 | Average $43,982 |
| Belgians | 58.1 /100 | #168 | Average $43,951 |
| Immigrants | Peru | 55.3 /100 | #169 | Average $43,852 |
| Scandinavians | 55.2 /100 | #170 | Average $43,848 |
| Immigrants | Eastern Africa | 54.9 /100 | #171 | Average $43,838 |
| Czechoslovakians | 54.1 /100 | #172 | Average $43,806 |
| French | 50.7 /100 | #173 | Average $43,685 |
Demographics Similar to Dutch by Per Capita Income
In terms of per capita income, the demographic groups most similar to Dutch are Scotch-Irish ($42,563, a difference of 0.10%), Immigrants from Kenya ($42,661, a difference of 0.13%), Immigrants from Fiji ($42,694, a difference of 0.21%), Immigrants from Sierra Leone ($42,752, a difference of 0.34%), and Iraqi ($42,760, a difference of 0.36%).
| Demographics | Rating | Rank | Per Capita Income |
| Bermudans | 30.1 /100 | #189 | Fair $42,911 |
| Kenyans | 27.7 /100 | #190 | Fair $42,808 |
| Yugoslavians | 27.4 /100 | #191 | Fair $42,792 |
| Iraqis | 26.7 /100 | #192 | Fair $42,760 |
| Immigrants | Sierra Leone | 26.5 /100 | #193 | Fair $42,752 |
| Immigrants | Fiji | 25.2 /100 | #194 | Fair $42,694 |
| Immigrants | Kenya | 24.5 /100 | #195 | Fair $42,661 |
| Dutch | 23.4 /100 | #196 | Fair $42,605 |
| Scotch-Irish | 22.6 /100 | #197 | Fair $42,563 |
| Immigrants | Portugal | 19.7 /100 | #198 | Poor $42,412 |
| Barbadians | 19.6 /100 | #199 | Poor $42,406 |
| Vietnamese | 19.0 /100 | #200 | Poor $42,368 |
| Immigrants | Thailand | 17.6 /100 | #201 | Poor $42,289 |
| Immigrants | Bosnia and Herzegovina | 17.5 /100 | #202 | Poor $42,278 |
| Spanish | 17.0 /100 | #203 | Poor $42,249 |