Immigrants from Uruguay vs Immigrants from Costa Rica Master's Degree
COMPARE
Immigrants from Uruguay
Immigrants from Costa Rica
Master's Degree
Master's Degree Comparison
Immigrants from Uruguay
Immigrants from Costa Rica
15.0%
MASTER'S DEGREE
52.8/ 100
METRIC RATING
172nd/ 347
METRIC RANK
14.7%
MASTER'S DEGREE
36.2/ 100
METRIC RATING
188th/ 347
METRIC RANK
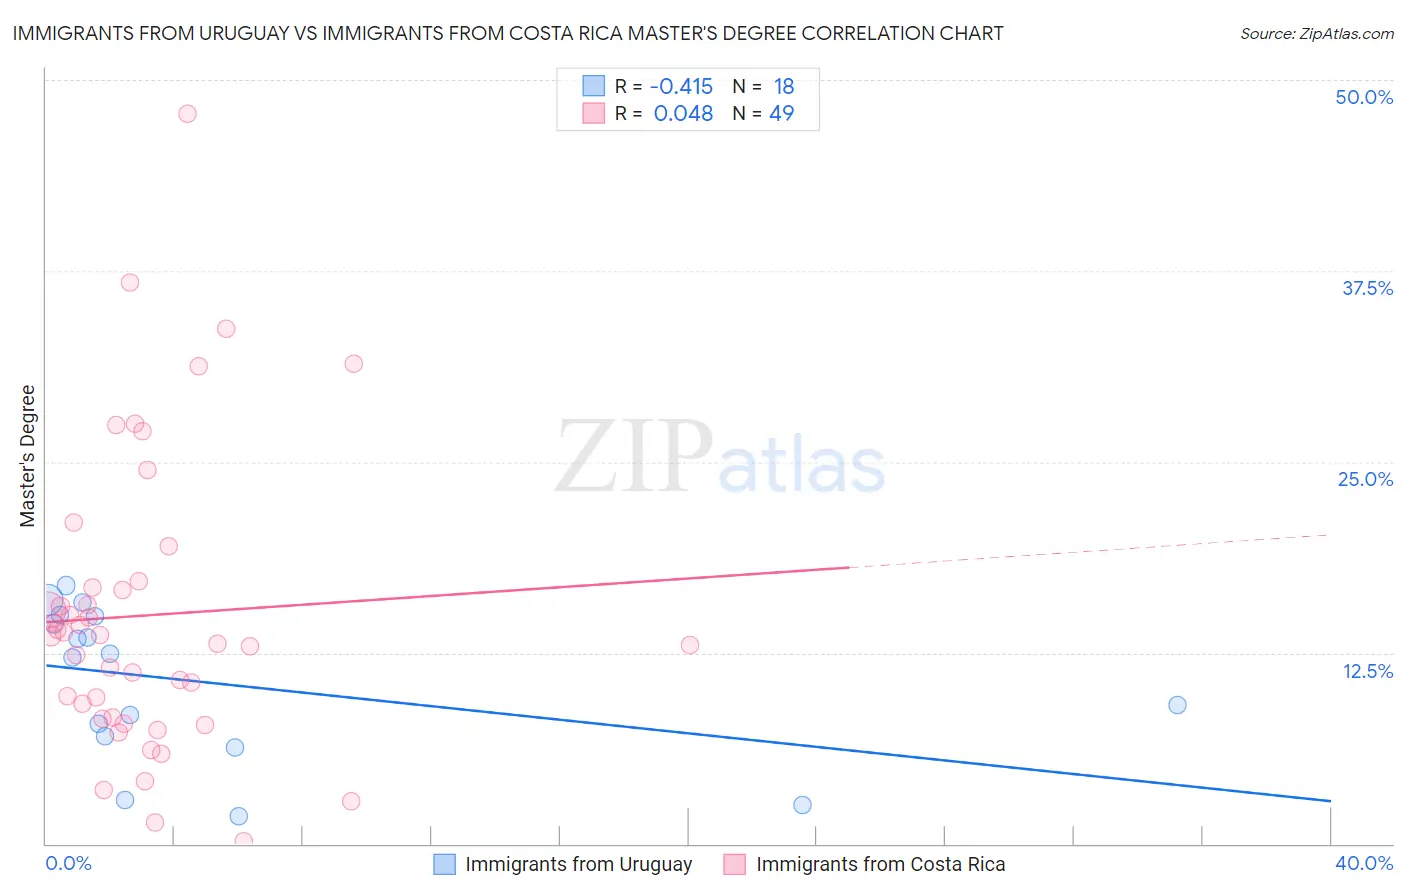
Immigrants from Uruguay vs Immigrants from Costa Rica Master's Degree Correlation Chart
The statistical analysis conducted on geographies consisting of 133,247,285 people shows a moderate negative correlation between the proportion of Immigrants from Uruguay and percentage of population with at least master's degree education in the United States with a correlation coefficient (R) of -0.415 and weighted average of 15.0%. Similarly, the statistical analysis conducted on geographies consisting of 204,272,848 people shows no correlation between the proportion of Immigrants from Costa Rica and percentage of population with at least master's degree education in the United States with a correlation coefficient (R) of 0.048 and weighted average of 14.7%, a difference of 2.2%.
Master's Degree Correlation Summary
| Measurement | Immigrants from Uruguay | Immigrants from Costa Rica |
| Minimum | 1.8% | 0.13% |
| Maximum | 16.9% | 47.8% |
| Range | 15.1% | 47.7% |
| Mean | 10.6% | 15.0% |
| Median | 12.3% | 13.6% |
| Interquartile 25% (IQ1) | 7.1% | 8.2% |
| Interquartile 75% (IQ3) | 14.9% | 17.0% |
| Interquartile Range (IQR) | 7.8% | 8.8% |
| Standard Deviation (Sample) | 5.0% | 9.7% |
| Standard Deviation (Population) | 4.8% | 9.6% |
Demographics Similar to Immigrants from Uruguay and Immigrants from Costa Rica by Master's Degree
In terms of master's degree, the demographic groups most similar to Immigrants from Uruguay are Costa Rican (15.0%, a difference of 0.040%), Immigrants from Ghana (15.0%, a difference of 0.10%), Slovak (14.9%, a difference of 0.36%), Immigrants from Peru (14.9%, a difference of 0.40%), and Irish (15.0%, a difference of 0.46%). Similarly, the demographic groups most similar to Immigrants from Costa Rica are Basque (14.7%, a difference of 0.040%), Immigrants (14.6%, a difference of 0.040%), Spaniard (14.6%, a difference of 0.060%), Immigrants from Oceania (14.7%, a difference of 0.12%), and Barbadian (14.7%, a difference of 0.29%).
| Demographics | Rating | Rank | Master's Degree |
| Irish | 56.3 /100 | #170 | Average 15.0% |
| Immigrants | Ghana | 53.6 /100 | #171 | Average 15.0% |
| Immigrants | Uruguay | 52.8 /100 | #172 | Average 15.0% |
| Costa Ricans | 52.5 /100 | #173 | Average 15.0% |
| Slovaks | 50.0 /100 | #174 | Average 14.9% |
| Immigrants | Peru | 49.6 /100 | #175 | Average 14.9% |
| Nigerians | 48.6 /100 | #176 | Average 14.9% |
| Immigrants | Colombia | 48.3 /100 | #177 | Average 14.9% |
| English | 45.0 /100 | #178 | Average 14.8% |
| Immigrants | Iraq | 41.3 /100 | #179 | Average 14.8% |
| Celtics | 41.3 /100 | #180 | Average 14.8% |
| Swiss | 41.1 /100 | #181 | Average 14.7% |
| Czechs | 40.4 /100 | #182 | Average 14.7% |
| Sri Lankans | 39.6 /100 | #183 | Fair 14.7% |
| Immigrants | Zaire | 39.5 /100 | #184 | Fair 14.7% |
| Barbadians | 38.3 /100 | #185 | Fair 14.7% |
| Immigrants | Oceania | 37.1 /100 | #186 | Fair 14.7% |
| Basques | 36.5 /100 | #187 | Fair 14.7% |
| Immigrants | Costa Rica | 36.2 /100 | #188 | Fair 14.7% |
| Immigrants | Immigrants | 36.0 /100 | #189 | Fair 14.6% |
| Spaniards | 35.8 /100 | #190 | Fair 14.6% |