Immigrants from Uruguay vs Eastern European Disability Age Over 75
COMPARE
Immigrants from Uruguay
Eastern European
Disability Age Over 75
Disability Age Over 75 Comparison
Immigrants from Uruguay
Eastern Europeans
46.4%
DISABILITY AGE OVER 75
96.7/ 100
METRIC RATING
107th/ 347
METRIC RANK
44.8%
DISABILITY AGE OVER 75
100.0/ 100
METRIC RATING
3rd/ 347
METRIC RANK
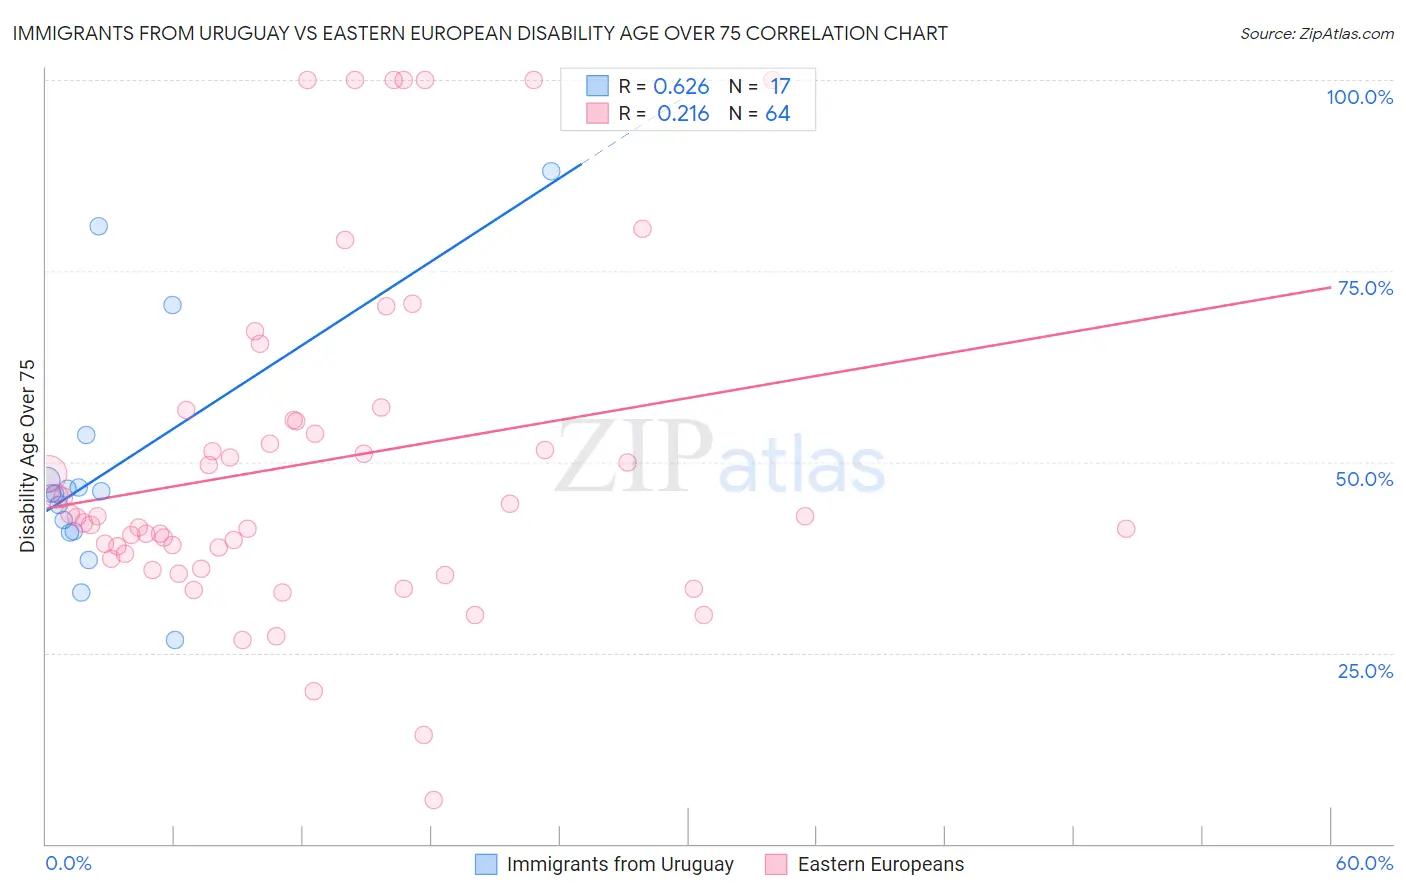
Immigrants from Uruguay vs Eastern European Disability Age Over 75 Correlation Chart
The statistical analysis conducted on geographies consisting of 133,242,093 people shows a significant positive correlation between the proportion of Immigrants from Uruguay and percentage of population with a disability over the age of 75 in the United States with a correlation coefficient (R) of 0.626 and weighted average of 46.4%. Similarly, the statistical analysis conducted on geographies consisting of 460,398,021 people shows a weak positive correlation between the proportion of Eastern Europeans and percentage of population with a disability over the age of 75 in the United States with a correlation coefficient (R) of 0.216 and weighted average of 44.8%, a difference of 3.7%.
Disability Age Over 75 Correlation Summary
| Measurement | Immigrants from Uruguay | Eastern European |
| Minimum | 26.7% | 5.7% |
| Maximum | 88.0% | 100.0% |
| Range | 61.3% | 94.3% |
| Mean | 49.2% | 49.9% |
| Median | 45.9% | 42.8% |
| Interquartile 25% (IQ1) | 40.9% | 37.7% |
| Interquartile 75% (IQ3) | 50.6% | 55.5% |
| Interquartile Range (IQR) | 9.7% | 17.8% |
| Standard Deviation (Sample) | 16.1% | 22.1% |
| Standard Deviation (Population) | 15.6% | 21.9% |
Similar Demographics by Disability Age Over 75
Demographics Similar to Immigrants from Uruguay by Disability Age Over 75
In terms of disability age over 75, the demographic groups most similar to Immigrants from Uruguay are Brazilian (46.5%, a difference of 0.010%), Immigrants from Kuwait (46.4%, a difference of 0.030%), Chilean (46.5%, a difference of 0.040%), Immigrants from Cameroon (46.4%, a difference of 0.050%), and Immigrants from Hong Kong (46.5%, a difference of 0.050%).
| Demographics | Rating | Rank | Disability Age Over 75 |
| Immigrants | Eastern Europe | 97.7 /100 | #100 | Exceptional 46.3% |
| Mongolians | 97.7 /100 | #101 | Exceptional 46.3% |
| Immigrants | Malaysia | 97.1 /100 | #102 | Exceptional 46.4% |
| Ukrainians | 97.1 /100 | #103 | Exceptional 46.4% |
| Israelis | 97.0 /100 | #104 | Exceptional 46.4% |
| Immigrants | Cameroon | 96.9 /100 | #105 | Exceptional 46.4% |
| Immigrants | Kuwait | 96.8 /100 | #106 | Exceptional 46.4% |
| Immigrants | Uruguay | 96.7 /100 | #107 | Exceptional 46.4% |
| Brazilians | 96.6 /100 | #108 | Exceptional 46.5% |
| Chileans | 96.4 /100 | #109 | Exceptional 46.5% |
| Immigrants | Hong Kong | 96.4 /100 | #110 | Exceptional 46.5% |
| Immigrants | Chile | 96.4 /100 | #111 | Exceptional 46.5% |
| Immigrants | Pakistan | 96.1 /100 | #112 | Exceptional 46.5% |
| Irish | 96.0 /100 | #113 | Exceptional 46.5% |
| Dutch | 95.9 /100 | #114 | Exceptional 46.5% |
Demographics Similar to Eastern Europeans by Disability Age Over 75
In terms of disability age over 75, the demographic groups most similar to Eastern Europeans are Carpatho Rusyn (44.8%, a difference of 0.030%), Luxembourger (44.8%, a difference of 0.090%), Immigrants from Lithuania (44.9%, a difference of 0.18%), Okinawan (44.9%, a difference of 0.22%), and Immigrants from Ireland (44.7%, a difference of 0.29%).
| Demographics | Rating | Rank | Disability Age Over 75 |
| Cypriots | 100.0 /100 | #1 | Exceptional 43.5% |
| Immigrants | Ireland | 100.0 /100 | #2 | Exceptional 44.7% |
| Eastern Europeans | 100.0 /100 | #3 | Exceptional 44.8% |
| Carpatho Rusyns | 100.0 /100 | #4 | Exceptional 44.8% |
| Luxembourgers | 100.0 /100 | #5 | Exceptional 44.8% |
| Immigrants | Lithuania | 100.0 /100 | #6 | Exceptional 44.9% |
| Okinawans | 100.0 /100 | #7 | Exceptional 44.9% |
| Immigrants | Austria | 100.0 /100 | #8 | Exceptional 44.9% |
| Paraguayans | 100.0 /100 | #9 | Exceptional 45.0% |
| Bulgarians | 100.0 /100 | #10 | Exceptional 45.1% |
| Lithuanians | 100.0 /100 | #11 | Exceptional 45.1% |
| Immigrants | Czechoslovakia | 100.0 /100 | #12 | Exceptional 45.1% |
| Latvians | 100.0 /100 | #13 | Exceptional 45.1% |
| Immigrants | Scotland | 100.0 /100 | #14 | Exceptional 45.1% |
| Immigrants | Sweden | 100.0 /100 | #15 | Exceptional 45.1% |