Immigrants from Uganda vs German Russian 1st Grade
COMPARE
Immigrants from Uganda
German Russian
1st Grade
1st Grade Comparison
Immigrants from Uganda
German Russians
97.8%
1ST GRADE
18.2/ 100
METRIC RATING
204th/ 347
METRIC RANK
98.2%
1ST GRADE
97.1/ 100
METRIC RATING
109th/ 347
METRIC RANK
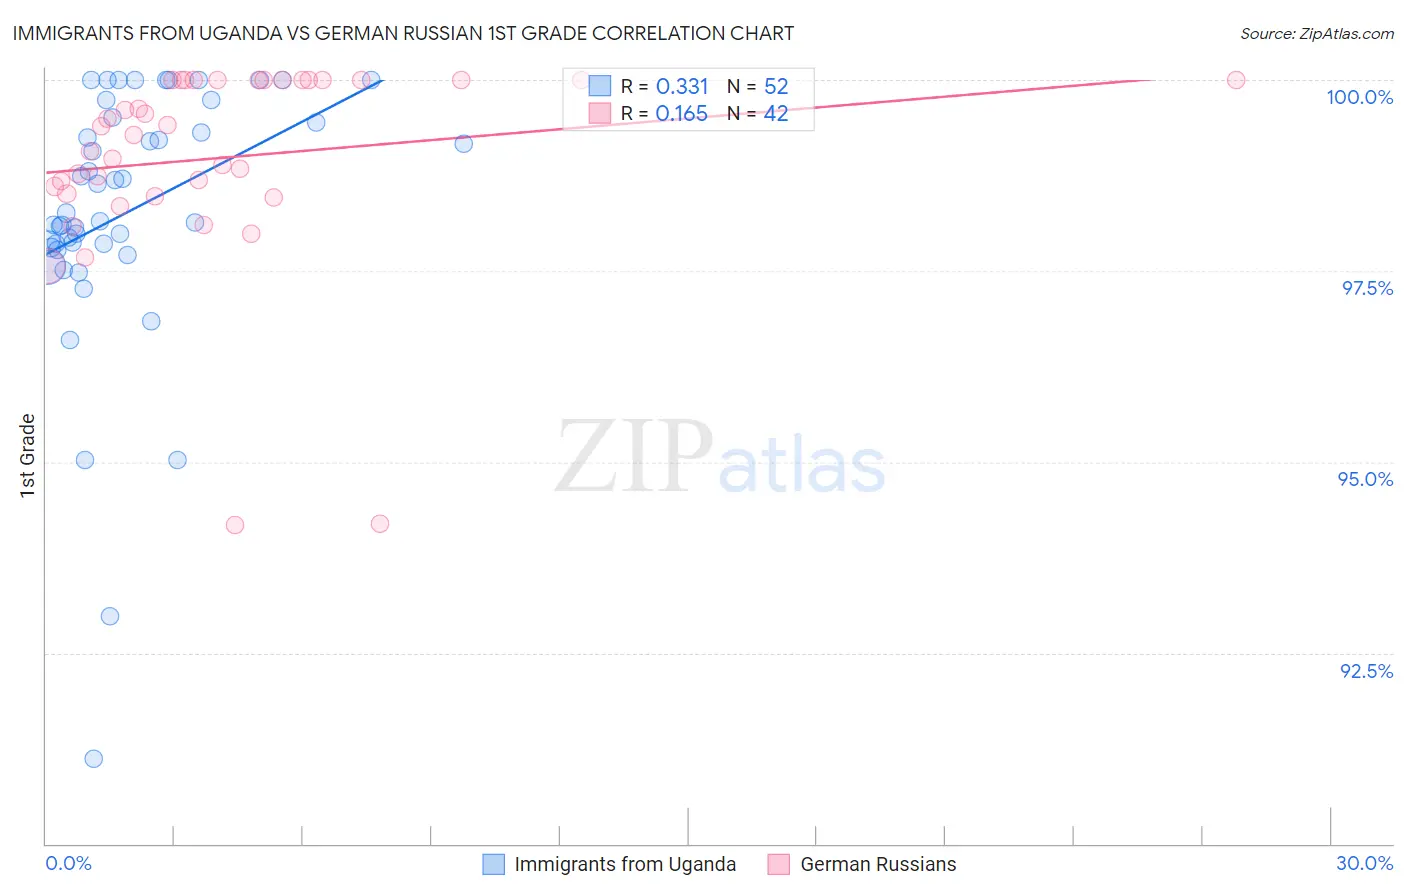
Immigrants from Uganda vs German Russian 1st Grade Correlation Chart
The statistical analysis conducted on geographies consisting of 125,941,298 people shows a mild positive correlation between the proportion of Immigrants from Uganda and percentage of population with at least 1st grade education in the United States with a correlation coefficient (R) of 0.331 and weighted average of 97.8%. Similarly, the statistical analysis conducted on geographies consisting of 96,461,520 people shows a poor positive correlation between the proportion of German Russians and percentage of population with at least 1st grade education in the United States with a correlation coefficient (R) of 0.165 and weighted average of 98.2%, a difference of 0.39%.
1st Grade Correlation Summary
| Measurement | Immigrants from Uganda | German Russian |
| Minimum | 91.1% | 94.2% |
| Maximum | 100.0% | 100.0% |
| Range | 8.9% | 5.8% |
| Mean | 98.3% | 99.0% |
| Median | 98.2% | 99.3% |
| Interquartile 25% (IQ1) | 97.8% | 98.5% |
| Interquartile 75% (IQ3) | 99.5% | 100.0% |
| Interquartile Range (IQR) | 1.6% | 1.5% |
| Standard Deviation (Sample) | 1.7% | 1.3% |
| Standard Deviation (Population) | 1.7% | 1.3% |
Similar Demographics by 1st Grade
Demographics Similar to Immigrants from Uganda by 1st Grade
In terms of 1st grade, the demographic groups most similar to Immigrants from Uganda are Immigrants from Southern Europe (97.8%, a difference of 0.0%), Immigrants from Chile (97.8%, a difference of 0.0%), Immigrants from Albania (97.8%, a difference of 0.0%), Immigrants from Lebanon (97.8%, a difference of 0.010%), and Immigrants from Ukraine (97.8%, a difference of 0.010%).
| Demographics | Rating | Rank | 1st Grade |
| Guamanians/Chamorros | 26.2 /100 | #197 | Fair 97.8% |
| Yuman | 24.4 /100 | #198 | Fair 97.8% |
| Tohono O'odham | 23.2 /100 | #199 | Fair 97.8% |
| Immigrants | Egypt | 22.6 /100 | #200 | Fair 97.8% |
| Immigrants | Lebanon | 20.1 /100 | #201 | Fair 97.8% |
| Immigrants | Ukraine | 19.2 /100 | #202 | Poor 97.8% |
| Immigrants | Southern Europe | 18.2 /100 | #203 | Poor 97.8% |
| Immigrants | Uganda | 18.2 /100 | #204 | Poor 97.8% |
| Immigrants | Chile | 17.7 /100 | #205 | Poor 97.8% |
| Immigrants | Albania | 17.3 /100 | #206 | Poor 97.8% |
| Africans | 16.5 /100 | #207 | Poor 97.8% |
| Immigrants | Northern Africa | 12.0 /100 | #208 | Poor 97.8% |
| Costa Ricans | 11.6 /100 | #209 | Poor 97.8% |
| Immigrants | Oceania | 11.0 /100 | #210 | Poor 97.8% |
| Laotians | 10.3 /100 | #211 | Poor 97.8% |
Demographics Similar to German Russians by 1st Grade
In terms of 1st grade, the demographic groups most similar to German Russians are Immigrants from Switzerland (98.2%, a difference of 0.0%), Bhutanese (98.2%, a difference of 0.0%), Pima (98.2%, a difference of 0.010%), Basque (98.2%, a difference of 0.010%), and Turkish (98.2%, a difference of 0.010%).
| Demographics | Rating | Rank | 1st Grade |
| Cree | 97.8 /100 | #102 | Exceptional 98.2% |
| Immigrants | Ireland | 97.7 /100 | #103 | Exceptional 98.2% |
| Pima | 97.5 /100 | #104 | Exceptional 98.2% |
| Basques | 97.4 /100 | #105 | Exceptional 98.2% |
| Turks | 97.4 /100 | #106 | Exceptional 98.2% |
| Immigrants | Switzerland | 97.3 /100 | #107 | Exceptional 98.2% |
| Bhutanese | 97.3 /100 | #108 | Exceptional 98.2% |
| German Russians | 97.1 /100 | #109 | Exceptional 98.2% |
| Immigrants | Singapore | 96.7 /100 | #110 | Exceptional 98.2% |
| Immigrants | Czechoslovakia | 96.6 /100 | #111 | Exceptional 98.2% |
| Immigrants | Norway | 96.6 /100 | #112 | Exceptional 98.2% |
| Immigrants | Latvia | 96.4 /100 | #113 | Exceptional 98.2% |
| Ute | 96.2 /100 | #114 | Exceptional 98.2% |
| Iranians | 96.0 /100 | #115 | Exceptional 98.2% |
| Spanish | 95.9 /100 | #116 | Exceptional 98.2% |