Immigrants from Uganda vs German Russian Median Male Earnings
COMPARE
Immigrants from Uganda
German Russian
Median Male Earnings
Median Male Earnings Comparison
Immigrants from Uganda
German Russians
$56,064
MEDIAN MALE EARNINGS
82.4/ 100
METRIC RATING
144th/ 347
METRIC RANK
$49,924
MEDIAN MALE EARNINGS
1.1/ 100
METRIC RATING
253rd/ 347
METRIC RANK
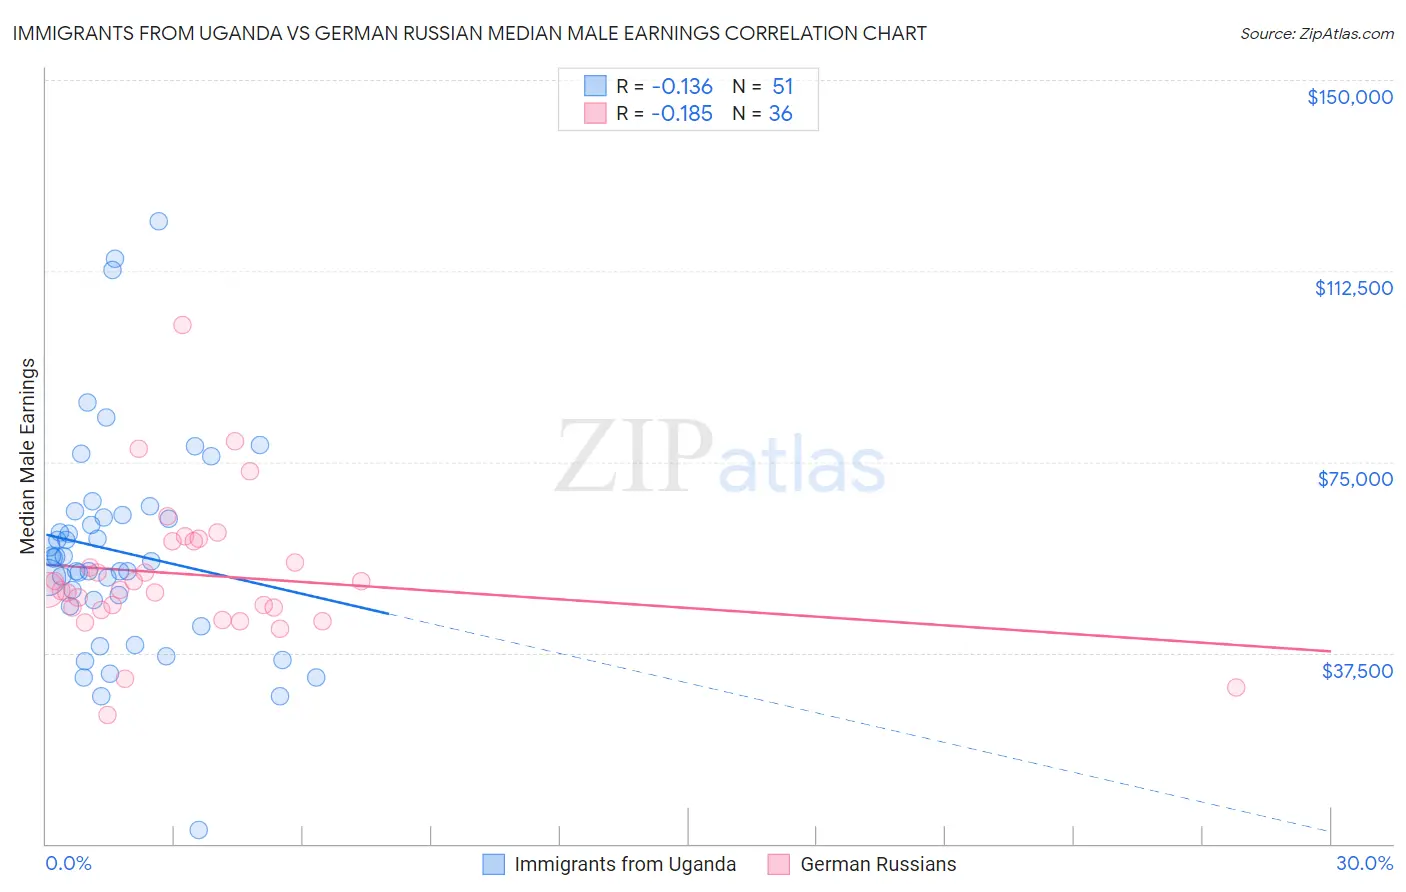
Immigrants from Uganda vs German Russian Median Male Earnings Correlation Chart
The statistical analysis conducted on geographies consisting of 125,972,834 people shows a poor negative correlation between the proportion of Immigrants from Uganda and median male earnings in the United States with a correlation coefficient (R) of -0.136 and weighted average of $56,064. Similarly, the statistical analysis conducted on geographies consisting of 96,455,245 people shows a poor negative correlation between the proportion of German Russians and median male earnings in the United States with a correlation coefficient (R) of -0.185 and weighted average of $49,924, a difference of 12.3%.
Median Male Earnings Correlation Summary
| Measurement | Immigrants from Uganda | German Russian |
| Minimum | $2,614 | $25,295 |
| Maximum | $122,344 | $101,964 |
| Range | $119,730 | $76,669 |
| Mean | $57,441 | $52,820 |
| Median | $56,129 | $49,866 |
| Interquartile 25% (IQ1) | $46,713 | $46,118 |
| Interquartile 75% (IQ3) | $64,485 | $59,385 |
| Interquartile Range (IQR) | $17,772 | $13,267 |
| Standard Deviation (Sample) | $21,598 | $14,069 |
| Standard Deviation (Population) | $21,385 | $13,873 |
Similar Demographics by Median Male Earnings
Demographics Similar to Immigrants from Uganda by Median Male Earnings
In terms of median male earnings, the demographic groups most similar to Immigrants from Uganda are Sri Lankan ($56,136, a difference of 0.13%), Norwegian ($55,965, a difference of 0.18%), Immigrants from Chile ($55,954, a difference of 0.20%), Danish ($56,246, a difference of 0.32%), and Ethiopian ($56,243, a difference of 0.32%).
| Demographics | Rating | Rank | Median Male Earnings |
| Slavs | 86.5 /100 | #137 | Excellent $56,390 |
| Slovaks | 85.5 /100 | #138 | Excellent $56,306 |
| Zimbabweans | 85.5 /100 | #139 | Excellent $56,302 |
| Luxembourgers | 85.5 /100 | #140 | Excellent $56,300 |
| Danes | 84.8 /100 | #141 | Excellent $56,246 |
| Ethiopians | 84.8 /100 | #142 | Excellent $56,243 |
| Sri Lankans | 83.4 /100 | #143 | Excellent $56,136 |
| Immigrants | Uganda | 82.4 /100 | #144 | Excellent $56,064 |
| Norwegians | 80.9 /100 | #145 | Excellent $55,965 |
| Immigrants | Chile | 80.7 /100 | #146 | Excellent $55,954 |
| Immigrants | Philippines | 78.4 /100 | #147 | Good $55,809 |
| Scottish | 78.2 /100 | #148 | Good $55,793 |
| English | 77.4 /100 | #149 | Good $55,747 |
| Swiss | 77.1 /100 | #150 | Good $55,731 |
| Immigrants | Oceania | 76.8 /100 | #151 | Good $55,712 |
Demographics Similar to German Russians by Median Male Earnings
In terms of median male earnings, the demographic groups most similar to German Russians are Immigrants from Cabo Verde ($50,009, a difference of 0.17%), Senegalese ($49,774, a difference of 0.30%), Alaskan Athabascan ($49,748, a difference of 0.35%), Alaska Native ($49,711, a difference of 0.43%), and British West Indian ($49,636, a difference of 0.58%).
| Demographics | Rating | Rank | Median Male Earnings |
| Immigrants | Ecuador | 1.9 /100 | #246 | Tragic $50,474 |
| Sub-Saharan Africans | 1.8 /100 | #247 | Tragic $50,408 |
| Immigrants | Guyana | 1.6 /100 | #248 | Tragic $50,321 |
| Immigrants | Burma/Myanmar | 1.6 /100 | #249 | Tragic $50,298 |
| Osage | 1.6 /100 | #250 | Tragic $50,292 |
| Immigrants | Grenada | 1.6 /100 | #251 | Tragic $50,279 |
| Immigrants | Cabo Verde | 1.2 /100 | #252 | Tragic $50,009 |
| German Russians | 1.1 /100 | #253 | Tragic $49,924 |
| Senegalese | 1.0 /100 | #254 | Tragic $49,774 |
| Alaskan Athabascans | 0.9 /100 | #255 | Tragic $49,748 |
| Alaska Natives | 0.9 /100 | #256 | Tragic $49,711 |
| British West Indians | 0.8 /100 | #257 | Tragic $49,636 |
| Cree | 0.7 /100 | #258 | Tragic $49,497 |
| Nepalese | 0.7 /100 | #259 | Tragic $49,458 |
| Iroquois | 0.7 /100 | #260 | Tragic $49,374 |