Immigrants from Uganda vs Creek Householder Income Ages 45 - 64 years
COMPARE
Immigrants from Uganda
Creek
Householder Income Ages 45 - 64 years
Householder Income Ages 45 - 64 years Comparison
Immigrants from Uganda
Creek
$103,584
HOUSEHOLDER INCOME AGES 45 - 64 YEARS
83.7/ 100
METRIC RATING
141st/ 347
METRIC RANK
$78,960
HOUSEHOLDER INCOME AGES 45 - 64 YEARS
0.0/ 100
METRIC RATING
330th/ 347
METRIC RANK
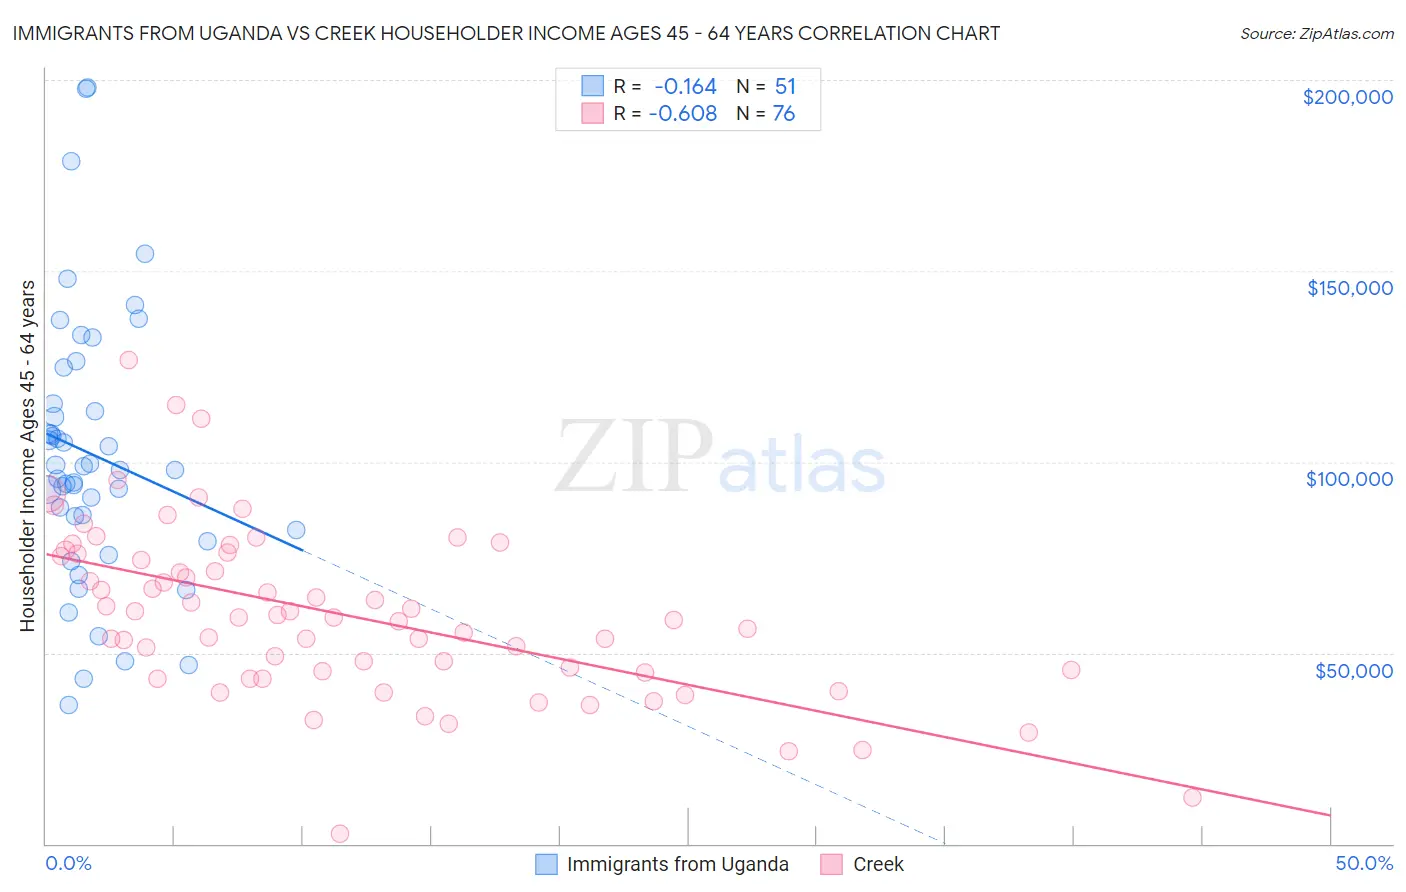
Immigrants from Uganda vs Creek Householder Income Ages 45 - 64 years Correlation Chart
The statistical analysis conducted on geographies consisting of 125,945,072 people shows a poor negative correlation between the proportion of Immigrants from Uganda and household income with householder between the ages 45 and 64 in the United States with a correlation coefficient (R) of -0.164 and weighted average of $103,584. Similarly, the statistical analysis conducted on geographies consisting of 178,286,108 people shows a significant negative correlation between the proportion of Creek and household income with householder between the ages 45 and 64 in the United States with a correlation coefficient (R) of -0.608 and weighted average of $78,960, a difference of 31.2%.
Householder Income Ages 45 - 64 years Correlation Summary
| Measurement | Immigrants from Uganda | Creek |
| Minimum | $36,234 | $2,499 |
| Maximum | $198,089 | $126,578 |
| Range | $161,856 | $124,079 |
| Mean | $101,898 | $60,049 |
| Median | $97,891 | $59,292 |
| Interquartile 25% (IQ1) | $82,188 | $45,146 |
| Interquartile 75% (IQ3) | $115,253 | $75,639 |
| Interquartile Range (IQR) | $33,065 | $30,493 |
| Standard Deviation (Sample) | $35,142 | $22,341 |
| Standard Deviation (Population) | $34,796 | $22,193 |
Similar Demographics by Householder Income Ages 45 - 64 years
Demographics Similar to Immigrants from Uganda by Householder Income Ages 45 - 64 years
In terms of householder income ages 45 - 64 years, the demographic groups most similar to Immigrants from Uganda are Luxembourger ($103,536, a difference of 0.050%), Serbian ($103,522, a difference of 0.060%), Czech ($103,507, a difference of 0.070%), Norwegian ($103,682, a difference of 0.090%), and Ugandan ($103,472, a difference of 0.11%).
| Demographics | Rating | Rank | Householder Income Ages 45 - 64 years |
| Canadians | 89.3 /100 | #134 | Excellent $104,560 |
| Brazilians | 88.6 /100 | #135 | Excellent $104,408 |
| Taiwanese | 87.4 /100 | #136 | Excellent $104,180 |
| Hungarians | 85.8 /100 | #137 | Excellent $103,913 |
| Ethiopians | 84.7 /100 | #138 | Excellent $103,736 |
| Immigrants | Oceania | 84.5 /100 | #139 | Excellent $103,705 |
| Norwegians | 84.3 /100 | #140 | Excellent $103,682 |
| Immigrants | Uganda | 83.7 /100 | #141 | Excellent $103,584 |
| Luxembourgers | 83.3 /100 | #142 | Excellent $103,536 |
| Serbians | 83.2 /100 | #143 | Excellent $103,522 |
| Czechs | 83.1 /100 | #144 | Excellent $103,507 |
| Ugandans | 82.9 /100 | #145 | Excellent $103,472 |
| Immigrants | Chile | 82.5 /100 | #146 | Excellent $103,412 |
| Basques | 82.3 /100 | #147 | Excellent $103,387 |
| Immigrants | Germany | 81.5 /100 | #148 | Excellent $103,282 |
Demographics Similar to Creek by Householder Income Ages 45 - 64 years
In terms of householder income ages 45 - 64 years, the demographic groups most similar to Creek are Immigrants from Dominican Republic ($78,836, a difference of 0.16%), Dutch West Indian ($79,171, a difference of 0.27%), Black/African American ($78,556, a difference of 0.51%), Native/Alaskan ($79,816, a difference of 1.1%), and Seminole ($80,077, a difference of 1.4%).
| Demographics | Rating | Rank | Householder Income Ages 45 - 64 years |
| Bahamians | 0.0 /100 | #323 | Tragic $81,369 |
| Yup'ik | 0.0 /100 | #324 | Tragic $81,000 |
| Immigrants | Cuba | 0.0 /100 | #325 | Tragic $80,662 |
| Dominicans | 0.0 /100 | #326 | Tragic $80,623 |
| Seminole | 0.0 /100 | #327 | Tragic $80,077 |
| Natives/Alaskans | 0.0 /100 | #328 | Tragic $79,816 |
| Dutch West Indians | 0.0 /100 | #329 | Tragic $79,171 |
| Creek | 0.0 /100 | #330 | Tragic $78,960 |
| Immigrants | Dominican Republic | 0.0 /100 | #331 | Tragic $78,836 |
| Blacks/African Americans | 0.0 /100 | #332 | Tragic $78,556 |
| Immigrants | Congo | 0.0 /100 | #333 | Tragic $77,850 |
| Menominee | 0.0 /100 | #334 | Tragic $76,903 |
| Cheyenne | 0.0 /100 | #335 | Tragic $76,362 |
| Arapaho | 0.0 /100 | #336 | Tragic $75,945 |
| Pueblo | 0.0 /100 | #337 | Tragic $75,601 |