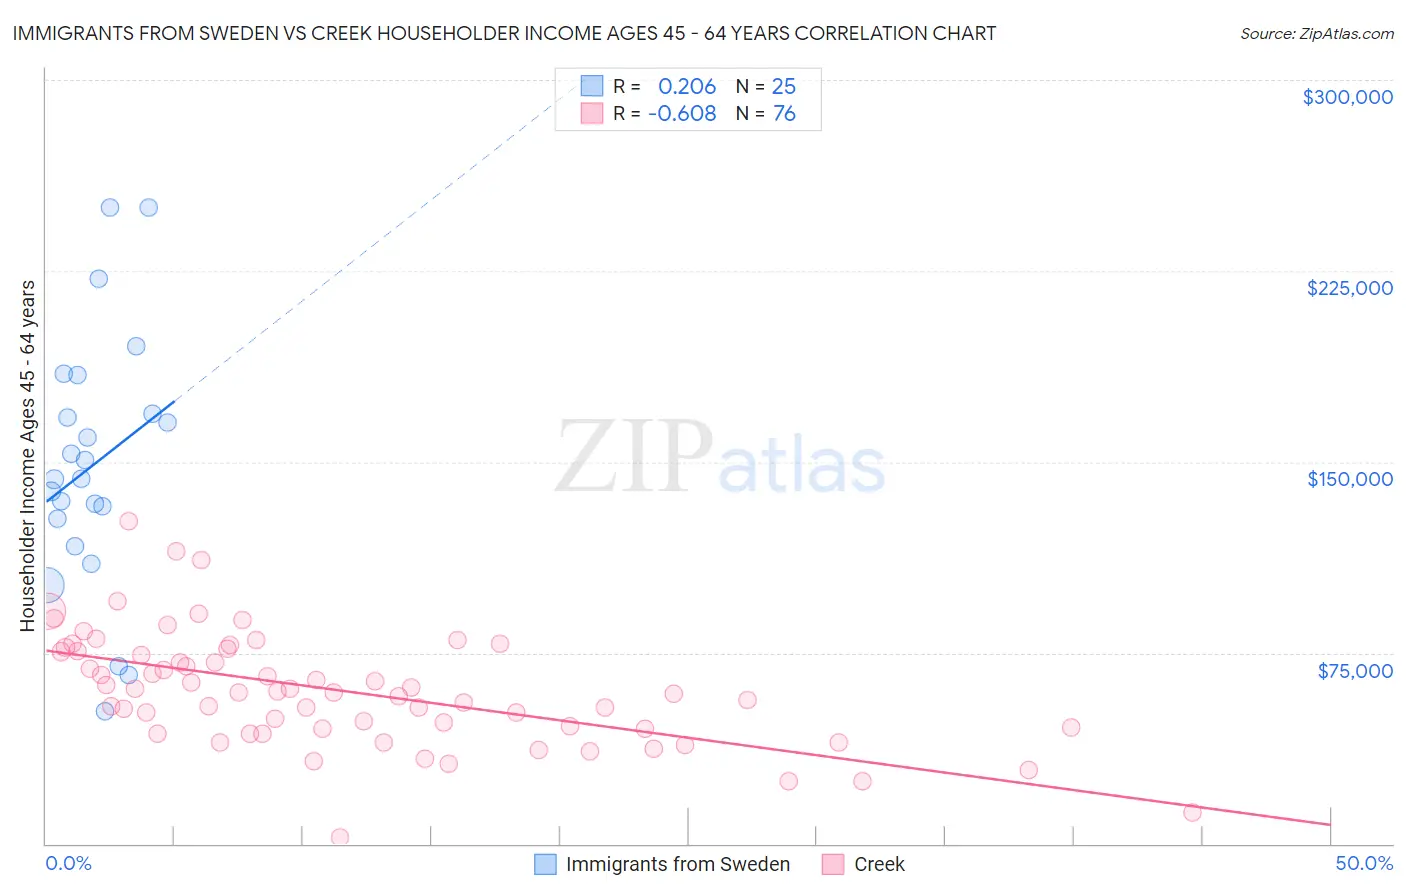
Immigrants from Sweden vs Creek Householder Income Ages 45 - 64 years
COMPARE
Immigrants from Sweden
Creek
Householder Income Ages 45 - 64 years
Householder Income Ages 45 - 64 years Comparison
Immigrants from Sweden
Creek
$118,318
HOUSEHOLDER INCOME AGES 45 - 64 YEARS
100.0/ 100
METRIC RATING
26th/ 347
METRIC RANK
$78,960
HOUSEHOLDER INCOME AGES 45 - 64 YEARS
0.0/ 100
METRIC RATING
330th/ 347
METRIC RANK
Immigrants from Sweden vs Creek Householder Income Ages 45 - 64 years Correlation Chart
The statistical analysis conducted on geographies consisting of 164,674,181 people shows a weak positive correlation between the proportion of Immigrants from Sweden and household income with householder between the ages 45 and 64 in the United States with a correlation coefficient (R) of 0.206 and weighted average of $118,318. Similarly, the statistical analysis conducted on geographies consisting of 178,286,108 people shows a significant negative correlation between the proportion of Creek and household income with householder between the ages 45 and 64 in the United States with a correlation coefficient (R) of -0.608 and weighted average of $78,960, a difference of 49.8%.
Householder Income Ages 45 - 64 years Correlation Summary
| Measurement | Immigrants from Sweden | Creek |
| Minimum | $52,031 | $2,499 |
| Maximum | $250,001 | $126,578 |
| Range | $197,970 | $124,079 |
| Mean | $148,842 | $60,049 |
| Median | $143,294 | $59,292 |
| Interquartile 25% (IQ1) | $122,314 | $45,146 |
| Interquartile 75% (IQ3) | $176,365 | $75,639 |
| Interquartile Range (IQR) | $54,051 | $30,493 |
| Standard Deviation (Sample) | $50,116 | $22,341 |
| Standard Deviation (Population) | $49,103 | $22,193 |
Similar Demographics by Householder Income Ages 45 - 64 years
Demographics Similar to Immigrants from Sweden by Householder Income Ages 45 - 64 years
In terms of householder income ages 45 - 64 years, the demographic groups most similar to Immigrants from Sweden are Asian ($118,426, a difference of 0.090%), Immigrants from Japan ($118,498, a difference of 0.15%), Immigrants from Northern Europe ($117,930, a difference of 0.33%), Turkish ($117,814, a difference of 0.43%), and Bolivian ($118,871, a difference of 0.47%).
| Demographics | Rating | Rank | Householder Income Ages 45 - 64 years |
| Eastern Europeans | 100.0 /100 | #19 | Exceptional $120,684 |
| Immigrants | Australia | 100.0 /100 | #20 | Exceptional $119,308 |
| Immigrants | Sri Lanka | 100.0 /100 | #21 | Exceptional $119,094 |
| Immigrants | Belgium | 100.0 /100 | #22 | Exceptional $118,932 |
| Bolivians | 100.0 /100 | #23 | Exceptional $118,871 |
| Immigrants | Japan | 100.0 /100 | #24 | Exceptional $118,498 |
| Asians | 100.0 /100 | #25 | Exceptional $118,426 |
| Immigrants | Sweden | 100.0 /100 | #26 | Exceptional $118,318 |
| Immigrants | Northern Europe | 100.0 /100 | #27 | Exceptional $117,930 |
| Turks | 100.0 /100 | #28 | Exceptional $117,814 |
| Bhutanese | 100.0 /100 | #29 | Exceptional $117,750 |
| Immigrants | Bolivia | 100.0 /100 | #30 | Exceptional $117,731 |
| Immigrants | Asia | 100.0 /100 | #31 | Exceptional $116,566 |
| Russians | 100.0 /100 | #32 | Exceptional $116,328 |
| Chinese | 100.0 /100 | #33 | Exceptional $116,156 |
Demographics Similar to Creek by Householder Income Ages 45 - 64 years
In terms of householder income ages 45 - 64 years, the demographic groups most similar to Creek are Immigrants from Dominican Republic ($78,836, a difference of 0.16%), Dutch West Indian ($79,171, a difference of 0.27%), Black/African American ($78,556, a difference of 0.51%), Native/Alaskan ($79,816, a difference of 1.1%), and Seminole ($80,077, a difference of 1.4%).
| Demographics | Rating | Rank | Householder Income Ages 45 - 64 years |
| Bahamians | 0.0 /100 | #323 | Tragic $81,369 |
| Yup'ik | 0.0 /100 | #324 | Tragic $81,000 |
| Immigrants | Cuba | 0.0 /100 | #325 | Tragic $80,662 |
| Dominicans | 0.0 /100 | #326 | Tragic $80,623 |
| Seminole | 0.0 /100 | #327 | Tragic $80,077 |
| Natives/Alaskans | 0.0 /100 | #328 | Tragic $79,816 |
| Dutch West Indians | 0.0 /100 | #329 | Tragic $79,171 |
| Creek | 0.0 /100 | #330 | Tragic $78,960 |
| Immigrants | Dominican Republic | 0.0 /100 | #331 | Tragic $78,836 |
| Blacks/African Americans | 0.0 /100 | #332 | Tragic $78,556 |
| Immigrants | Congo | 0.0 /100 | #333 | Tragic $77,850 |
| Menominee | 0.0 /100 | #334 | Tragic $76,903 |
| Cheyenne | 0.0 /100 | #335 | Tragic $76,362 |
| Arapaho | 0.0 /100 | #336 | Tragic $75,945 |
| Pueblo | 0.0 /100 | #337 | Tragic $75,601 |