Immigrants from Uganda vs Iranian Householder Income Ages 45 - 64 years
COMPARE
Immigrants from Uganda
Iranian
Householder Income Ages 45 - 64 years
Householder Income Ages 45 - 64 years Comparison
Immigrants from Uganda
Iranians
$103,584
HOUSEHOLDER INCOME AGES 45 - 64 YEARS
83.7/ 100
METRIC RATING
141st/ 347
METRIC RANK
$129,350
HOUSEHOLDER INCOME AGES 45 - 64 YEARS
100.0/ 100
METRIC RATING
6th/ 347
METRIC RANK
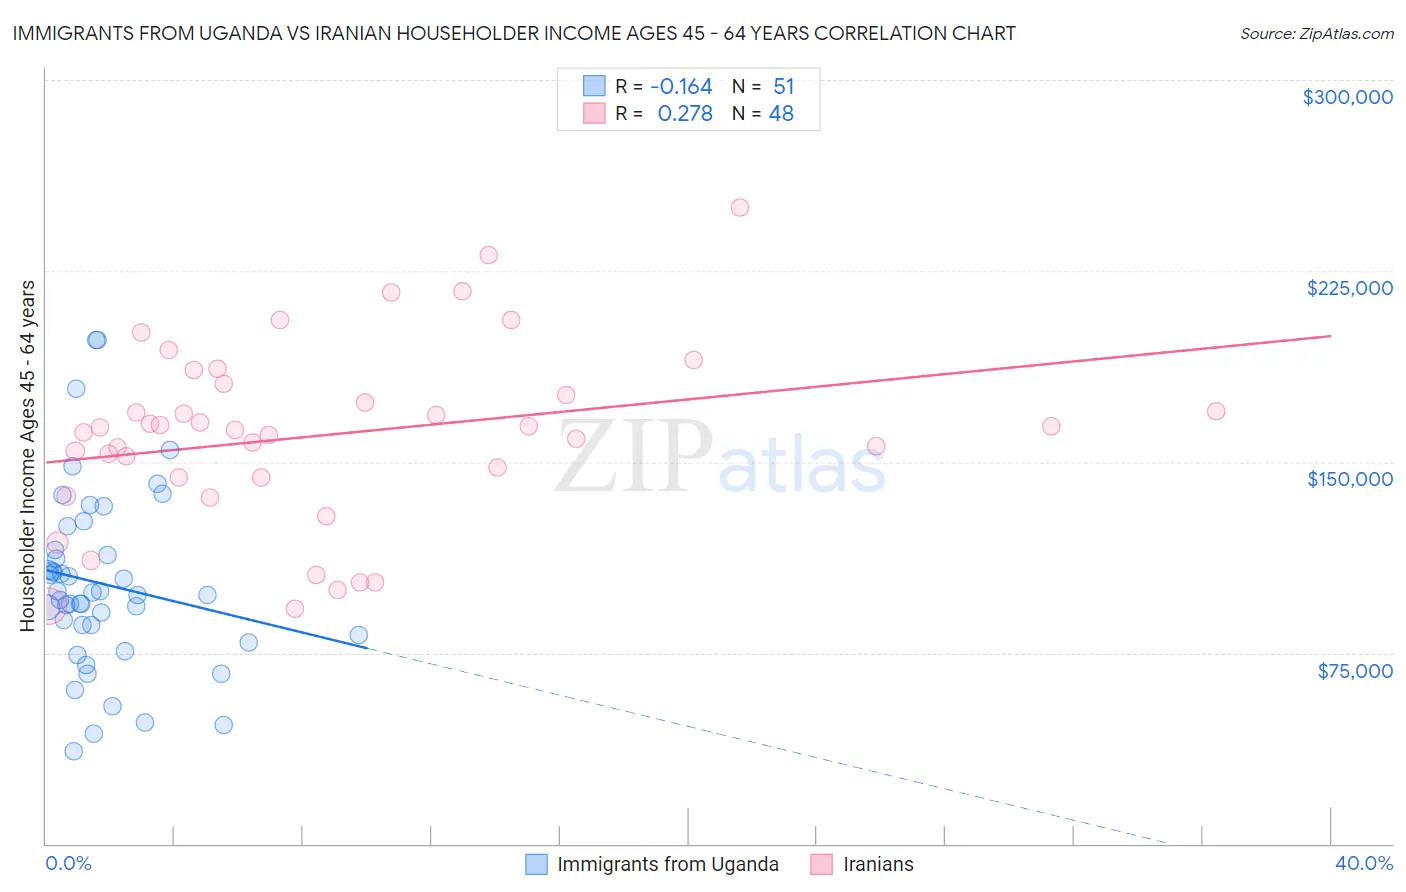
Immigrants from Uganda vs Iranian Householder Income Ages 45 - 64 years Correlation Chart
The statistical analysis conducted on geographies consisting of 125,945,072 people shows a poor negative correlation between the proportion of Immigrants from Uganda and household income with householder between the ages 45 and 64 in the United States with a correlation coefficient (R) of -0.164 and weighted average of $103,584. Similarly, the statistical analysis conducted on geographies consisting of 316,454,523 people shows a weak positive correlation between the proportion of Iranians and household income with householder between the ages 45 and 64 in the United States with a correlation coefficient (R) of 0.278 and weighted average of $129,350, a difference of 24.9%.
Householder Income Ages 45 - 64 years Correlation Summary
| Measurement | Immigrants from Uganda | Iranian |
| Minimum | $36,234 | $92,091 |
| Maximum | $198,089 | $250,001 |
| Range | $161,856 | $157,910 |
| Mean | $101,898 | $160,647 |
| Median | $97,891 | $162,915 |
| Interquartile 25% (IQ1) | $82,188 | $143,809 |
| Interquartile 75% (IQ3) | $115,253 | $178,661 |
| Interquartile Range (IQR) | $33,065 | $34,851 |
| Standard Deviation (Sample) | $35,142 | $35,600 |
| Standard Deviation (Population) | $34,796 | $35,228 |
Similar Demographics by Householder Income Ages 45 - 64 years
Demographics Similar to Immigrants from Uganda by Householder Income Ages 45 - 64 years
In terms of householder income ages 45 - 64 years, the demographic groups most similar to Immigrants from Uganda are Luxembourger ($103,536, a difference of 0.050%), Serbian ($103,522, a difference of 0.060%), Czech ($103,507, a difference of 0.070%), Norwegian ($103,682, a difference of 0.090%), and Ugandan ($103,472, a difference of 0.11%).
| Demographics | Rating | Rank | Householder Income Ages 45 - 64 years |
| Canadians | 89.3 /100 | #134 | Excellent $104,560 |
| Brazilians | 88.6 /100 | #135 | Excellent $104,408 |
| Taiwanese | 87.4 /100 | #136 | Excellent $104,180 |
| Hungarians | 85.8 /100 | #137 | Excellent $103,913 |
| Ethiopians | 84.7 /100 | #138 | Excellent $103,736 |
| Immigrants | Oceania | 84.5 /100 | #139 | Excellent $103,705 |
| Norwegians | 84.3 /100 | #140 | Excellent $103,682 |
| Immigrants | Uganda | 83.7 /100 | #141 | Excellent $103,584 |
| Luxembourgers | 83.3 /100 | #142 | Excellent $103,536 |
| Serbians | 83.2 /100 | #143 | Excellent $103,522 |
| Czechs | 83.1 /100 | #144 | Excellent $103,507 |
| Ugandans | 82.9 /100 | #145 | Excellent $103,472 |
| Immigrants | Chile | 82.5 /100 | #146 | Excellent $103,412 |
| Basques | 82.3 /100 | #147 | Excellent $103,387 |
| Immigrants | Germany | 81.5 /100 | #148 | Excellent $103,282 |
Demographics Similar to Iranians by Householder Income Ages 45 - 64 years
In terms of householder income ages 45 - 64 years, the demographic groups most similar to Iranians are Immigrants from Singapore ($129,514, a difference of 0.13%), Thai ($129,560, a difference of 0.16%), Immigrants from Hong Kong ($127,500, a difference of 1.5%), Immigrants from Iran ($126,940, a difference of 1.9%), and Immigrants from India ($132,488, a difference of 2.4%).
| Demographics | Rating | Rank | Householder Income Ages 45 - 64 years |
| Immigrants | Taiwan | 100.0 /100 | #1 | Exceptional $135,508 |
| Filipinos | 100.0 /100 | #2 | Exceptional $134,910 |
| Immigrants | India | 100.0 /100 | #3 | Exceptional $132,488 |
| Thais | 100.0 /100 | #4 | Exceptional $129,560 |
| Immigrants | Singapore | 100.0 /100 | #5 | Exceptional $129,514 |
| Iranians | 100.0 /100 | #6 | Exceptional $129,350 |
| Immigrants | Hong Kong | 100.0 /100 | #7 | Exceptional $127,500 |
| Immigrants | Iran | 100.0 /100 | #8 | Exceptional $126,940 |
| Okinawans | 100.0 /100 | #9 | Exceptional $124,796 |
| Immigrants | South Central Asia | 100.0 /100 | #10 | Exceptional $124,188 |
| Cypriots | 100.0 /100 | #11 | Exceptional $123,396 |
| Immigrants | Israel | 100.0 /100 | #12 | Exceptional $122,893 |
| Immigrants | Ireland | 100.0 /100 | #13 | Exceptional $122,757 |
| Indians (Asian) | 100.0 /100 | #14 | Exceptional $122,343 |
| Immigrants | Eastern Asia | 100.0 /100 | #15 | Exceptional $122,222 |