Immigrants from Uganda vs Sudanese Householder Income Ages 45 - 64 years
COMPARE
Immigrants from Uganda
Sudanese
Householder Income Ages 45 - 64 years
Householder Income Ages 45 - 64 years Comparison
Immigrants from Uganda
Sudanese
$103,584
HOUSEHOLDER INCOME AGES 45 - 64 YEARS
83.7/ 100
METRIC RATING
141st/ 347
METRIC RANK
$93,718
HOUSEHOLDER INCOME AGES 45 - 64 YEARS
3.5/ 100
METRIC RATING
232nd/ 347
METRIC RANK
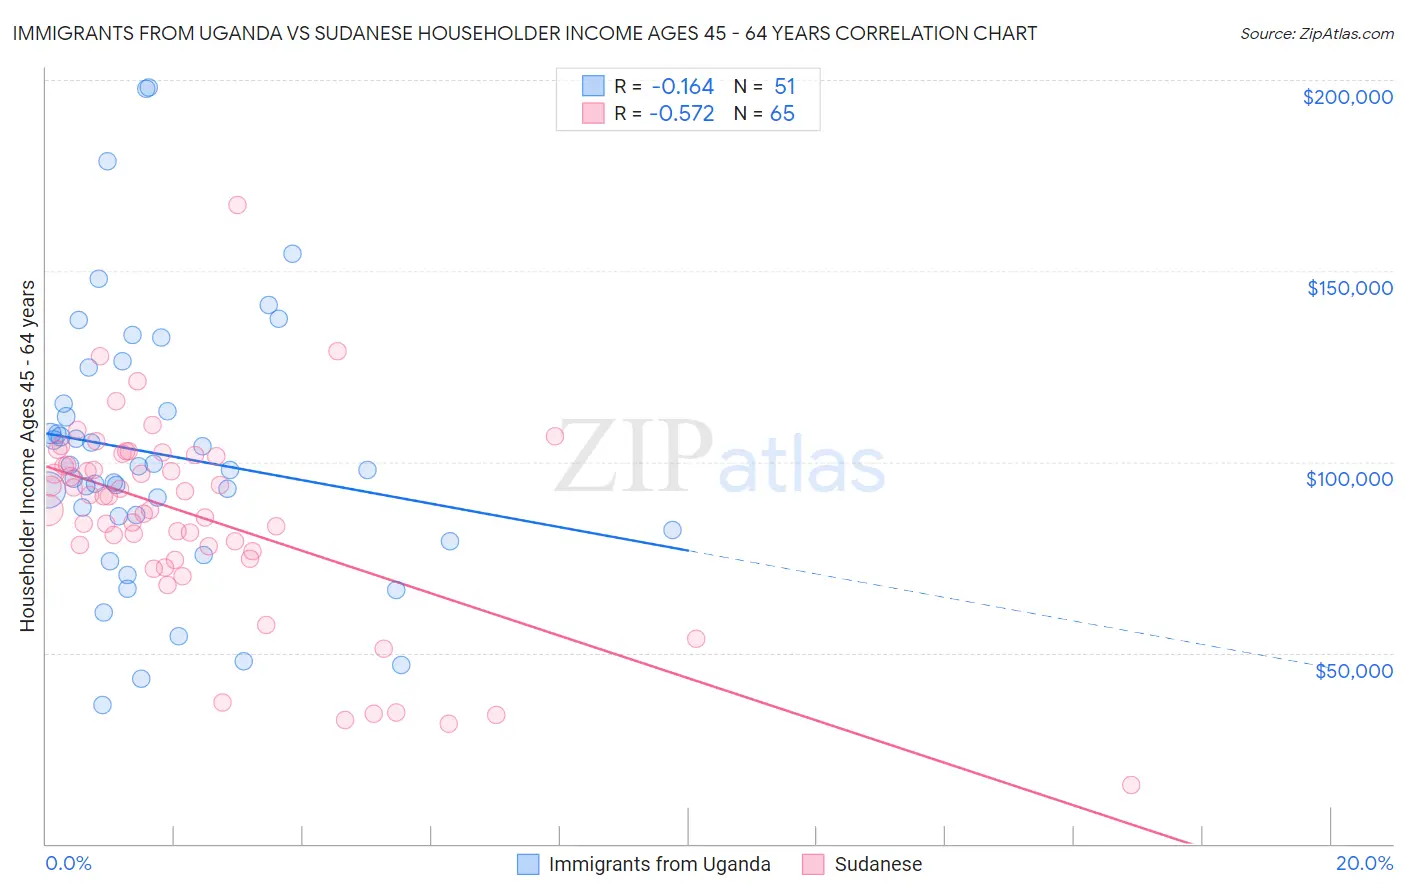
Immigrants from Uganda vs Sudanese Householder Income Ages 45 - 64 years Correlation Chart
The statistical analysis conducted on geographies consisting of 125,945,072 people shows a poor negative correlation between the proportion of Immigrants from Uganda and household income with householder between the ages 45 and 64 in the United States with a correlation coefficient (R) of -0.164 and weighted average of $103,584. Similarly, the statistical analysis conducted on geographies consisting of 110,067,983 people shows a substantial negative correlation between the proportion of Sudanese and household income with householder between the ages 45 and 64 in the United States with a correlation coefficient (R) of -0.572 and weighted average of $93,718, a difference of 10.5%.
Householder Income Ages 45 - 64 years Correlation Summary
| Measurement | Immigrants from Uganda | Sudanese |
| Minimum | $36,234 | $15,339 |
| Maximum | $198,089 | $167,134 |
| Range | $161,856 | $151,795 |
| Mean | $101,898 | $85,566 |
| Median | $97,891 | $90,864 |
| Interquartile 25% (IQ1) | $82,188 | $75,524 |
| Interquartile 75% (IQ3) | $115,253 | $101,575 |
| Interquartile Range (IQR) | $33,065 | $26,051 |
| Standard Deviation (Sample) | $35,142 | $26,171 |
| Standard Deviation (Population) | $34,796 | $25,969 |
Similar Demographics by Householder Income Ages 45 - 64 years
Demographics Similar to Immigrants from Uganda by Householder Income Ages 45 - 64 years
In terms of householder income ages 45 - 64 years, the demographic groups most similar to Immigrants from Uganda are Luxembourger ($103,536, a difference of 0.050%), Serbian ($103,522, a difference of 0.060%), Czech ($103,507, a difference of 0.070%), Norwegian ($103,682, a difference of 0.090%), and Ugandan ($103,472, a difference of 0.11%).
| Demographics | Rating | Rank | Householder Income Ages 45 - 64 years |
| Canadians | 89.3 /100 | #134 | Excellent $104,560 |
| Brazilians | 88.6 /100 | #135 | Excellent $104,408 |
| Taiwanese | 87.4 /100 | #136 | Excellent $104,180 |
| Hungarians | 85.8 /100 | #137 | Excellent $103,913 |
| Ethiopians | 84.7 /100 | #138 | Excellent $103,736 |
| Immigrants | Oceania | 84.5 /100 | #139 | Excellent $103,705 |
| Norwegians | 84.3 /100 | #140 | Excellent $103,682 |
| Immigrants | Uganda | 83.7 /100 | #141 | Excellent $103,584 |
| Luxembourgers | 83.3 /100 | #142 | Excellent $103,536 |
| Serbians | 83.2 /100 | #143 | Excellent $103,522 |
| Czechs | 83.1 /100 | #144 | Excellent $103,507 |
| Ugandans | 82.9 /100 | #145 | Excellent $103,472 |
| Immigrants | Chile | 82.5 /100 | #146 | Excellent $103,412 |
| Basques | 82.3 /100 | #147 | Excellent $103,387 |
| Immigrants | Germany | 81.5 /100 | #148 | Excellent $103,282 |
Demographics Similar to Sudanese by Householder Income Ages 45 - 64 years
In terms of householder income ages 45 - 64 years, the demographic groups most similar to Sudanese are Ecuadorian ($93,739, a difference of 0.020%), Vietnamese ($93,788, a difference of 0.070%), Immigrants from Sudan ($93,781, a difference of 0.070%), Immigrants from Panama ($93,815, a difference of 0.10%), and Alaska Native ($93,991, a difference of 0.29%).
| Demographics | Rating | Rank | Householder Income Ages 45 - 64 years |
| Bermudans | 4.4 /100 | #225 | Tragic $94,197 |
| Immigrants | Azores | 4.3 /100 | #226 | Tragic $94,138 |
| Alaska Natives | 4.0 /100 | #227 | Tragic $93,991 |
| Immigrants | Panama | 3.7 /100 | #228 | Tragic $93,815 |
| Vietnamese | 3.6 /100 | #229 | Tragic $93,788 |
| Immigrants | Sudan | 3.6 /100 | #230 | Tragic $93,781 |
| Ecuadorians | 3.6 /100 | #231 | Tragic $93,739 |
| Sudanese | 3.5 /100 | #232 | Tragic $93,718 |
| Nepalese | 3.0 /100 | #233 | Tragic $93,355 |
| Immigrants | El Salvador | 2.7 /100 | #234 | Tragic $93,176 |
| Nicaraguans | 2.0 /100 | #235 | Tragic $92,554 |
| Immigrants | Western Africa | 1.8 /100 | #236 | Tragic $92,384 |
| Immigrants | Bangladesh | 1.7 /100 | #237 | Tragic $92,208 |
| Pennsylvania Germans | 1.5 /100 | #238 | Tragic $91,956 |
| Immigrants | Ecuador | 1.2 /100 | #239 | Tragic $91,462 |