Dutch West Indian vs Creek Householder Income Ages 45 - 64 years
COMPARE
Dutch West Indian
Creek
Householder Income Ages 45 - 64 years
Householder Income Ages 45 - 64 years Comparison
Dutch West Indians
Creek
$79,171
HOUSEHOLDER INCOME AGES 45 - 64 YEARS
0.0/ 100
METRIC RATING
329th/ 347
METRIC RANK
$78,960
HOUSEHOLDER INCOME AGES 45 - 64 YEARS
0.0/ 100
METRIC RATING
330th/ 347
METRIC RANK
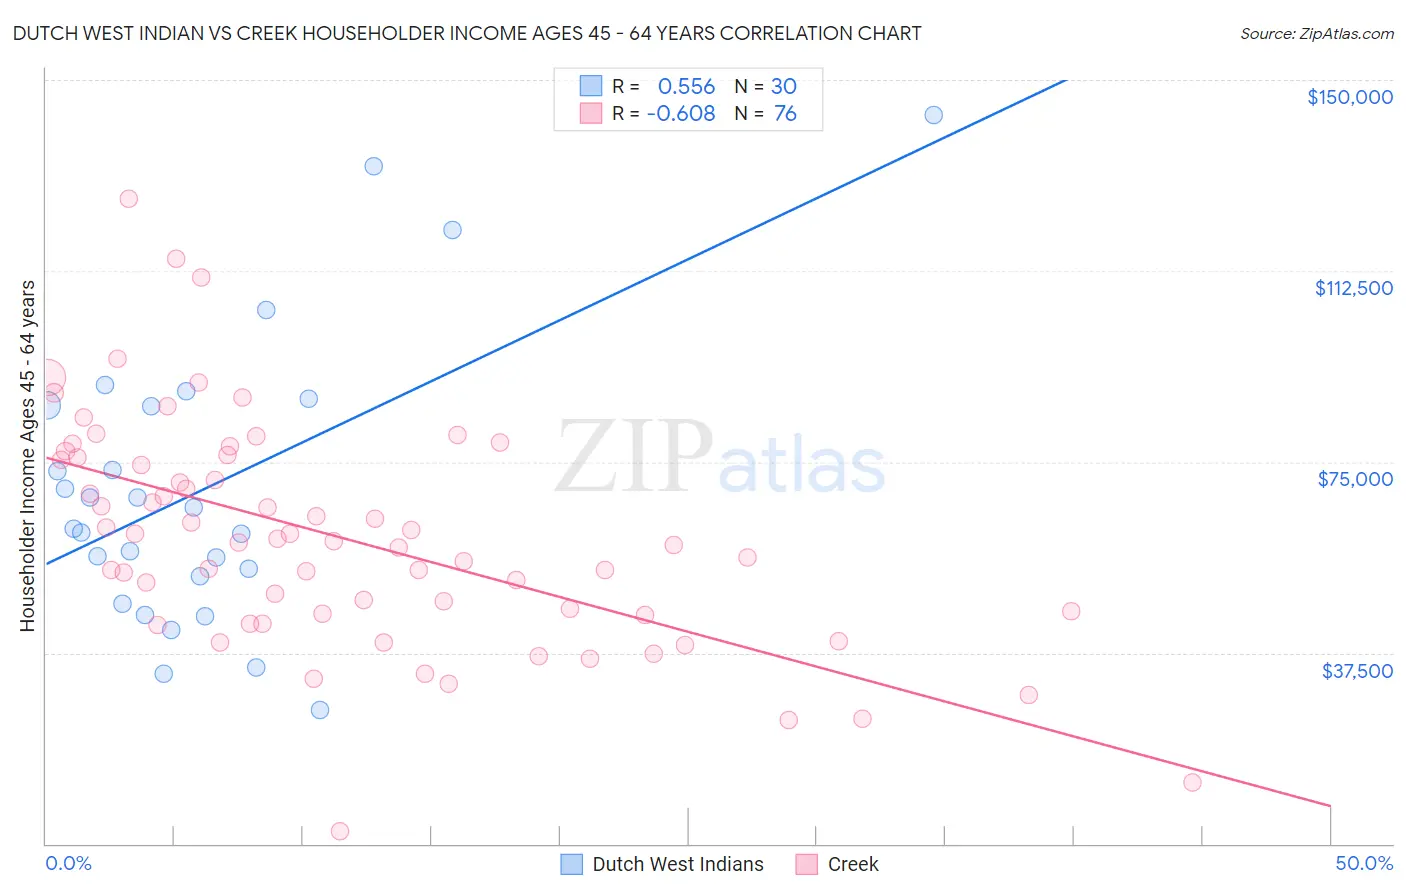
Dutch West Indian vs Creek Householder Income Ages 45 - 64 years Correlation Chart
The statistical analysis conducted on geographies consisting of 85,713,133 people shows a substantial positive correlation between the proportion of Dutch West Indians and household income with householder between the ages 45 and 64 in the United States with a correlation coefficient (R) of 0.556 and weighted average of $79,171. Similarly, the statistical analysis conducted on geographies consisting of 178,286,108 people shows a significant negative correlation between the proportion of Creek and household income with householder between the ages 45 and 64 in the United States with a correlation coefficient (R) of -0.608 and weighted average of $78,960, a difference of 0.27%.
Householder Income Ages 45 - 64 years Correlation Summary
| Measurement | Dutch West Indian | Creek |
| Minimum | $26,250 | $2,499 |
| Maximum | $143,214 | $126,578 |
| Range | $116,964 | $124,079 |
| Mean | $69,746 | $60,049 |
| Median | $63,988 | $59,292 |
| Interquartile 25% (IQ1) | $52,500 | $45,146 |
| Interquartile 75% (IQ3) | $86,138 | $75,639 |
| Interquartile Range (IQR) | $33,638 | $30,493 |
| Standard Deviation (Sample) | $28,236 | $22,341 |
| Standard Deviation (Population) | $27,762 | $22,193 |
Demographics Similar to Dutch West Indians and Creek by Householder Income Ages 45 - 64 years
In terms of householder income ages 45 - 64 years, the demographic groups most similar to Dutch West Indians are Immigrants from Dominican Republic ($78,836, a difference of 0.42%), Black/African American ($78,556, a difference of 0.78%), Native/Alaskan ($79,816, a difference of 0.82%), Seminole ($80,077, a difference of 1.1%), and Immigrants from Congo ($77,850, a difference of 1.7%). Similarly, the demographic groups most similar to Creek are Immigrants from Dominican Republic ($78,836, a difference of 0.16%), Black/African American ($78,556, a difference of 0.51%), Native/Alaskan ($79,816, a difference of 1.1%), Seminole ($80,077, a difference of 1.4%), and Immigrants from Congo ($77,850, a difference of 1.4%).
| Demographics | Rating | Rank | Householder Income Ages 45 - 64 years |
| Chickasaw | 0.0 /100 | #319 | Tragic $82,193 |
| Apache | 0.0 /100 | #320 | Tragic $82,184 |
| Yuman | 0.0 /100 | #321 | Tragic $82,139 |
| Sioux | 0.0 /100 | #322 | Tragic $81,750 |
| Bahamians | 0.0 /100 | #323 | Tragic $81,369 |
| Yup'ik | 0.0 /100 | #324 | Tragic $81,000 |
| Immigrants | Cuba | 0.0 /100 | #325 | Tragic $80,662 |
| Dominicans | 0.0 /100 | #326 | Tragic $80,623 |
| Seminole | 0.0 /100 | #327 | Tragic $80,077 |
| Natives/Alaskans | 0.0 /100 | #328 | Tragic $79,816 |
| Dutch West Indians | 0.0 /100 | #329 | Tragic $79,171 |
| Creek | 0.0 /100 | #330 | Tragic $78,960 |
| Immigrants | Dominican Republic | 0.0 /100 | #331 | Tragic $78,836 |
| Blacks/African Americans | 0.0 /100 | #332 | Tragic $78,556 |
| Immigrants | Congo | 0.0 /100 | #333 | Tragic $77,850 |
| Menominee | 0.0 /100 | #334 | Tragic $76,903 |
| Cheyenne | 0.0 /100 | #335 | Tragic $76,362 |
| Arapaho | 0.0 /100 | #336 | Tragic $75,945 |
| Pueblo | 0.0 /100 | #337 | Tragic $75,601 |
| Hopi | 0.0 /100 | #338 | Tragic $75,562 |
| Kiowa | 0.0 /100 | #339 | Tragic $74,815 |