Houma vs Canadian Householder Income Ages 45 - 64 years
COMPARE
Houma
Canadian
Householder Income Ages 45 - 64 years
Householder Income Ages 45 - 64 years Comparison
Houma
Canadians
$72,093
HOUSEHOLDER INCOME AGES 45 - 64 YEARS
0.0/ 100
METRIC RATING
344th/ 347
METRIC RANK
$104,560
HOUSEHOLDER INCOME AGES 45 - 64 YEARS
89.3/ 100
METRIC RATING
134th/ 347
METRIC RANK
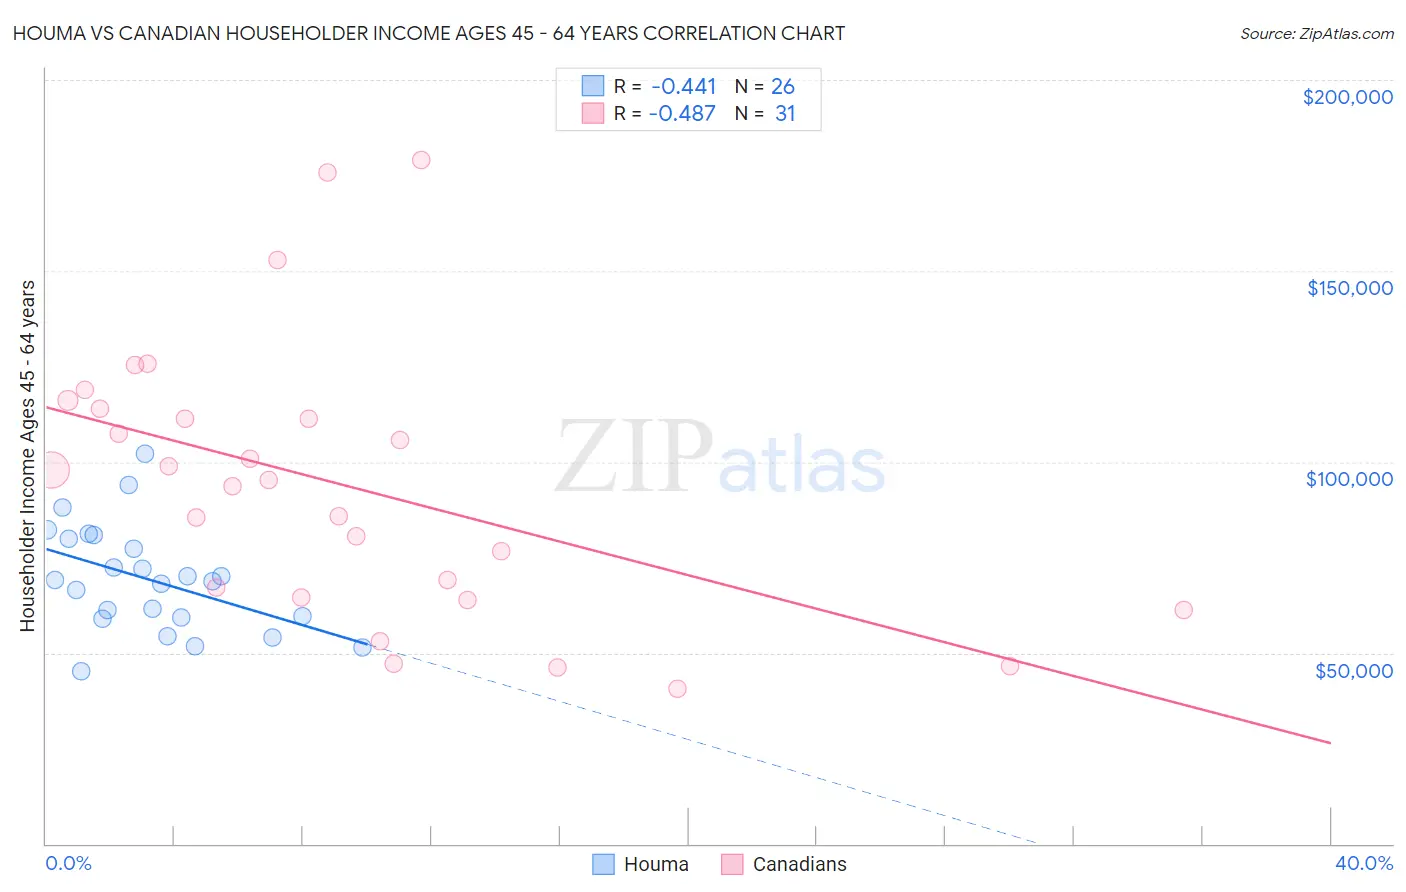
Houma vs Canadian Householder Income Ages 45 - 64 years Correlation Chart
The statistical analysis conducted on geographies consisting of 36,775,541 people shows a moderate negative correlation between the proportion of Houma and household income with householder between the ages 45 and 64 in the United States with a correlation coefficient (R) of -0.441 and weighted average of $72,093. Similarly, the statistical analysis conducted on geographies consisting of 436,616,971 people shows a moderate negative correlation between the proportion of Canadians and household income with householder between the ages 45 and 64 in the United States with a correlation coefficient (R) of -0.487 and weighted average of $104,560, a difference of 45.0%.
Householder Income Ages 45 - 64 years Correlation Summary
| Measurement | Houma | Canadian |
| Minimum | $45,223 | $40,750 |
| Maximum | $102,148 | $178,981 |
| Range | $56,925 | $138,231 |
| Mean | $69,210 | $94,099 |
| Median | $68,942 | $95,411 |
| Interquartile 25% (IQ1) | $59,348 | $64,375 |
| Interquartile 75% (IQ3) | $79,871 | $113,872 |
| Interquartile Range (IQR) | $20,523 | $49,497 |
| Standard Deviation (Sample) | $13,841 | $35,584 |
| Standard Deviation (Population) | $13,573 | $35,005 |
Similar Demographics by Householder Income Ages 45 - 64 years
Demographics Similar to Houma by Householder Income Ages 45 - 64 years
In terms of householder income ages 45 - 64 years, the demographic groups most similar to Houma are Pima ($73,365, a difference of 1.8%), Tohono O'odham ($73,774, a difference of 2.3%), Crow ($74,257, a difference of 3.0%), Navajo ($69,759, a difference of 3.4%), and Immigrants from Yemen ($74,575, a difference of 3.4%).
| Demographics | Rating | Rank | Householder Income Ages 45 - 64 years |
| Immigrants | Congo | 0.0 /100 | #333 | Tragic $77,850 |
| Menominee | 0.0 /100 | #334 | Tragic $76,903 |
| Cheyenne | 0.0 /100 | #335 | Tragic $76,362 |
| Arapaho | 0.0 /100 | #336 | Tragic $75,945 |
| Pueblo | 0.0 /100 | #337 | Tragic $75,601 |
| Hopi | 0.0 /100 | #338 | Tragic $75,562 |
| Kiowa | 0.0 /100 | #339 | Tragic $74,815 |
| Immigrants | Yemen | 0.0 /100 | #340 | Tragic $74,575 |
| Crow | 0.0 /100 | #341 | Tragic $74,257 |
| Tohono O'odham | 0.0 /100 | #342 | Tragic $73,774 |
| Pima | 0.0 /100 | #343 | Tragic $73,365 |
| Houma | 0.0 /100 | #344 | Tragic $72,093 |
| Navajo | 0.0 /100 | #345 | Tragic $69,759 |
| Puerto Ricans | 0.0 /100 | #346 | Tragic $69,234 |
| Lumbee | 0.0 /100 | #347 | Tragic $65,113 |
Demographics Similar to Canadians by Householder Income Ages 45 - 64 years
In terms of householder income ages 45 - 64 years, the demographic groups most similar to Canadians are Arab ($104,566, a difference of 0.010%), Brazilian ($104,408, a difference of 0.15%), Lebanese ($104,734, a difference of 0.17%), Immigrants from Syria ($104,858, a difference of 0.29%), and Taiwanese ($104,180, a difference of 0.36%).
| Demographics | Rating | Rank | Householder Income Ages 45 - 64 years |
| Immigrants | Saudi Arabia | 92.2 /100 | #127 | Exceptional $105,249 |
| Native Hawaiians | 91.8 /100 | #128 | Exceptional $105,149 |
| Peruvians | 91.5 /100 | #129 | Exceptional $105,070 |
| Immigrants | Zimbabwe | 91.2 /100 | #130 | Exceptional $104,992 |
| Immigrants | Syria | 90.7 /100 | #131 | Exceptional $104,858 |
| Lebanese | 90.1 /100 | #132 | Exceptional $104,734 |
| Arabs | 89.3 /100 | #133 | Excellent $104,566 |
| Canadians | 89.3 /100 | #134 | Excellent $104,560 |
| Brazilians | 88.6 /100 | #135 | Excellent $104,408 |
| Taiwanese | 87.4 /100 | #136 | Excellent $104,180 |
| Hungarians | 85.8 /100 | #137 | Excellent $103,913 |
| Ethiopians | 84.7 /100 | #138 | Excellent $103,736 |
| Immigrants | Oceania | 84.5 /100 | #139 | Excellent $103,705 |
| Norwegians | 84.3 /100 | #140 | Excellent $103,682 |
| Immigrants | Uganda | 83.7 /100 | #141 | Excellent $103,584 |