Mexican vs Canadian Householder Income Ages 45 - 64 years
COMPARE
Mexican
Canadian
Householder Income Ages 45 - 64 years
Householder Income Ages 45 - 64 years Comparison
Mexicans
Canadians
$86,816
HOUSEHOLDER INCOME AGES 45 - 64 YEARS
0.1/ 100
METRIC RATING
283rd/ 347
METRIC RANK
$104,560
HOUSEHOLDER INCOME AGES 45 - 64 YEARS
89.3/ 100
METRIC RATING
134th/ 347
METRIC RANK
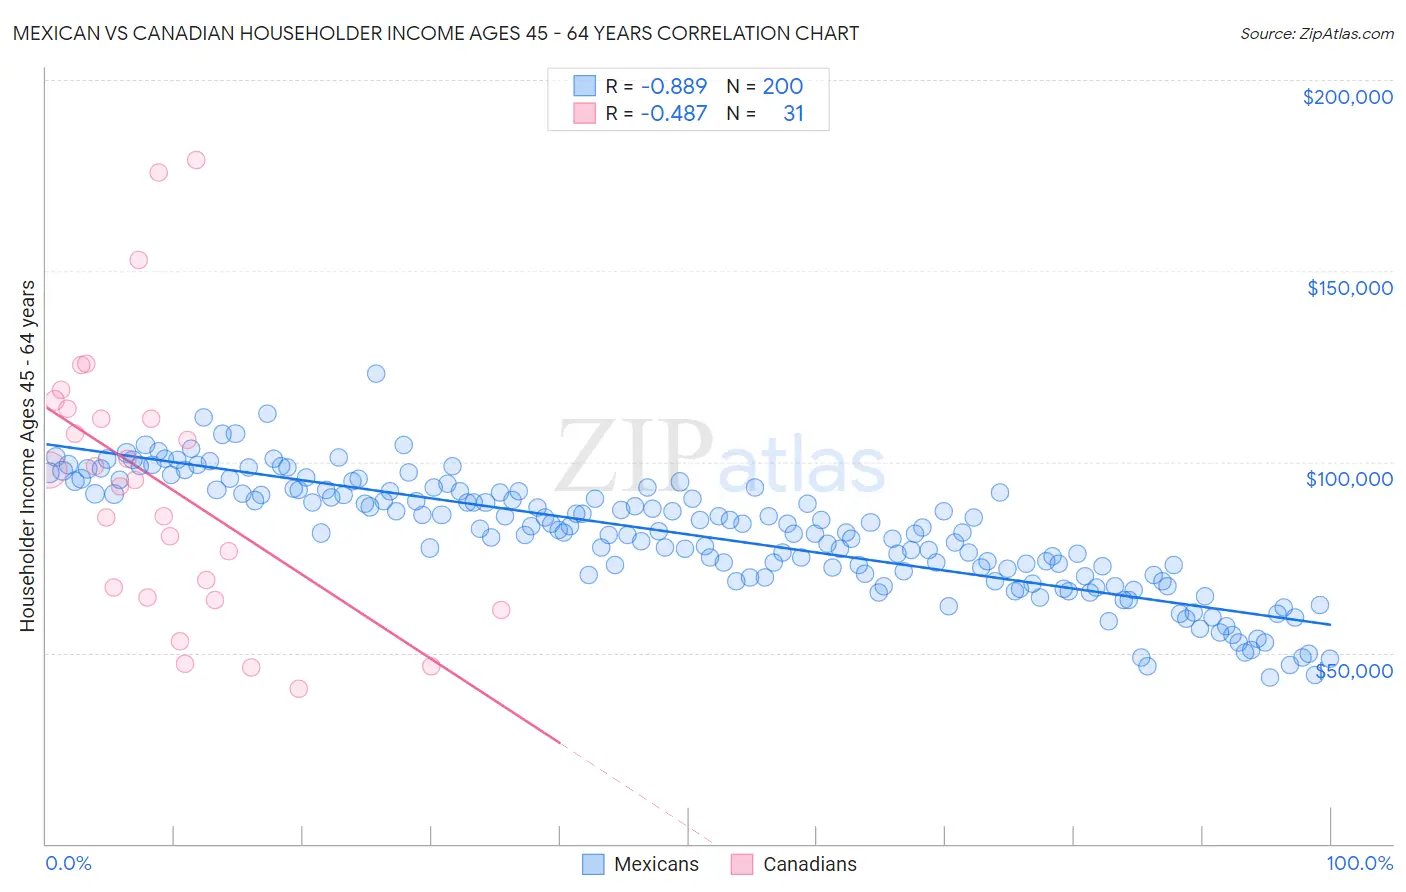
Mexican vs Canadian Householder Income Ages 45 - 64 years Correlation Chart
The statistical analysis conducted on geographies consisting of 561,629,225 people shows a very strong negative correlation between the proportion of Mexicans and household income with householder between the ages 45 and 64 in the United States with a correlation coefficient (R) of -0.889 and weighted average of $86,816. Similarly, the statistical analysis conducted on geographies consisting of 436,616,971 people shows a moderate negative correlation between the proportion of Canadians and household income with householder between the ages 45 and 64 in the United States with a correlation coefficient (R) of -0.487 and weighted average of $104,560, a difference of 20.4%.
Householder Income Ages 45 - 64 years Correlation Summary
| Measurement | Mexican | Canadian |
| Minimum | $43,450 | $40,750 |
| Maximum | $123,118 | $178,981 |
| Range | $79,668 | $138,231 |
| Mean | $80,968 | $94,099 |
| Median | $82,307 | $95,411 |
| Interquartile 25% (IQ1) | $70,470 | $64,375 |
| Interquartile 75% (IQ3) | $92,226 | $113,872 |
| Interquartile Range (IQR) | $21,757 | $49,497 |
| Standard Deviation (Sample) | $15,403 | $35,584 |
| Standard Deviation (Population) | $15,365 | $35,005 |
Similar Demographics by Householder Income Ages 45 - 64 years
Demographics Similar to Mexicans by Householder Income Ages 45 - 64 years
In terms of householder income ages 45 - 64 years, the demographic groups most similar to Mexicans are Central American Indian ($86,764, a difference of 0.060%), Senegalese ($86,897, a difference of 0.090%), Yaqui ($86,914, a difference of 0.11%), Yakama ($86,992, a difference of 0.20%), and Immigrants from Somalia ($86,987, a difference of 0.20%).
| Demographics | Rating | Rank | Householder Income Ages 45 - 64 years |
| Immigrants | Latin America | 0.1 /100 | #276 | Tragic $87,219 |
| Cree | 0.1 /100 | #277 | Tragic $87,185 |
| Immigrants | Jamaica | 0.1 /100 | #278 | Tragic $87,035 |
| Yakama | 0.1 /100 | #279 | Tragic $86,992 |
| Immigrants | Somalia | 0.1 /100 | #280 | Tragic $86,987 |
| Yaqui | 0.1 /100 | #281 | Tragic $86,914 |
| Senegalese | 0.1 /100 | #282 | Tragic $86,897 |
| Mexicans | 0.1 /100 | #283 | Tragic $86,816 |
| Central American Indians | 0.1 /100 | #284 | Tragic $86,764 |
| Blackfeet | 0.1 /100 | #285 | Tragic $86,595 |
| Immigrants | Guatemala | 0.1 /100 | #286 | Tragic $86,573 |
| Bangladeshis | 0.1 /100 | #287 | Tragic $86,402 |
| Immigrants | St. Vincent and the Grenadines | 0.1 /100 | #288 | Tragic $86,394 |
| Cubans | 0.1 /100 | #289 | Tragic $86,301 |
| Cherokee | 0.1 /100 | #290 | Tragic $86,125 |
Demographics Similar to Canadians by Householder Income Ages 45 - 64 years
In terms of householder income ages 45 - 64 years, the demographic groups most similar to Canadians are Arab ($104,566, a difference of 0.010%), Brazilian ($104,408, a difference of 0.15%), Lebanese ($104,734, a difference of 0.17%), Immigrants from Syria ($104,858, a difference of 0.29%), and Taiwanese ($104,180, a difference of 0.36%).
| Demographics | Rating | Rank | Householder Income Ages 45 - 64 years |
| Immigrants | Saudi Arabia | 92.2 /100 | #127 | Exceptional $105,249 |
| Native Hawaiians | 91.8 /100 | #128 | Exceptional $105,149 |
| Peruvians | 91.5 /100 | #129 | Exceptional $105,070 |
| Immigrants | Zimbabwe | 91.2 /100 | #130 | Exceptional $104,992 |
| Immigrants | Syria | 90.7 /100 | #131 | Exceptional $104,858 |
| Lebanese | 90.1 /100 | #132 | Exceptional $104,734 |
| Arabs | 89.3 /100 | #133 | Excellent $104,566 |
| Canadians | 89.3 /100 | #134 | Excellent $104,560 |
| Brazilians | 88.6 /100 | #135 | Excellent $104,408 |
| Taiwanese | 87.4 /100 | #136 | Excellent $104,180 |
| Hungarians | 85.8 /100 | #137 | Excellent $103,913 |
| Ethiopians | 84.7 /100 | #138 | Excellent $103,736 |
| Immigrants | Oceania | 84.5 /100 | #139 | Excellent $103,705 |
| Norwegians | 84.3 /100 | #140 | Excellent $103,682 |
| Immigrants | Uganda | 83.7 /100 | #141 | Excellent $103,584 |