Immigrants from Greece vs Peruvian Median Family Income
COMPARE
Immigrants from Greece
Peruvian
Median Family Income
Median Family Income Comparison
Immigrants from Greece
Peruvians
$117,344
MEDIAN FAMILY INCOME
99.9/ 100
METRIC RATING
45th/ 347
METRIC RANK
$105,444
MEDIAN FAMILY INCOME
80.4/ 100
METRIC RATING
151st/ 347
METRIC RANK
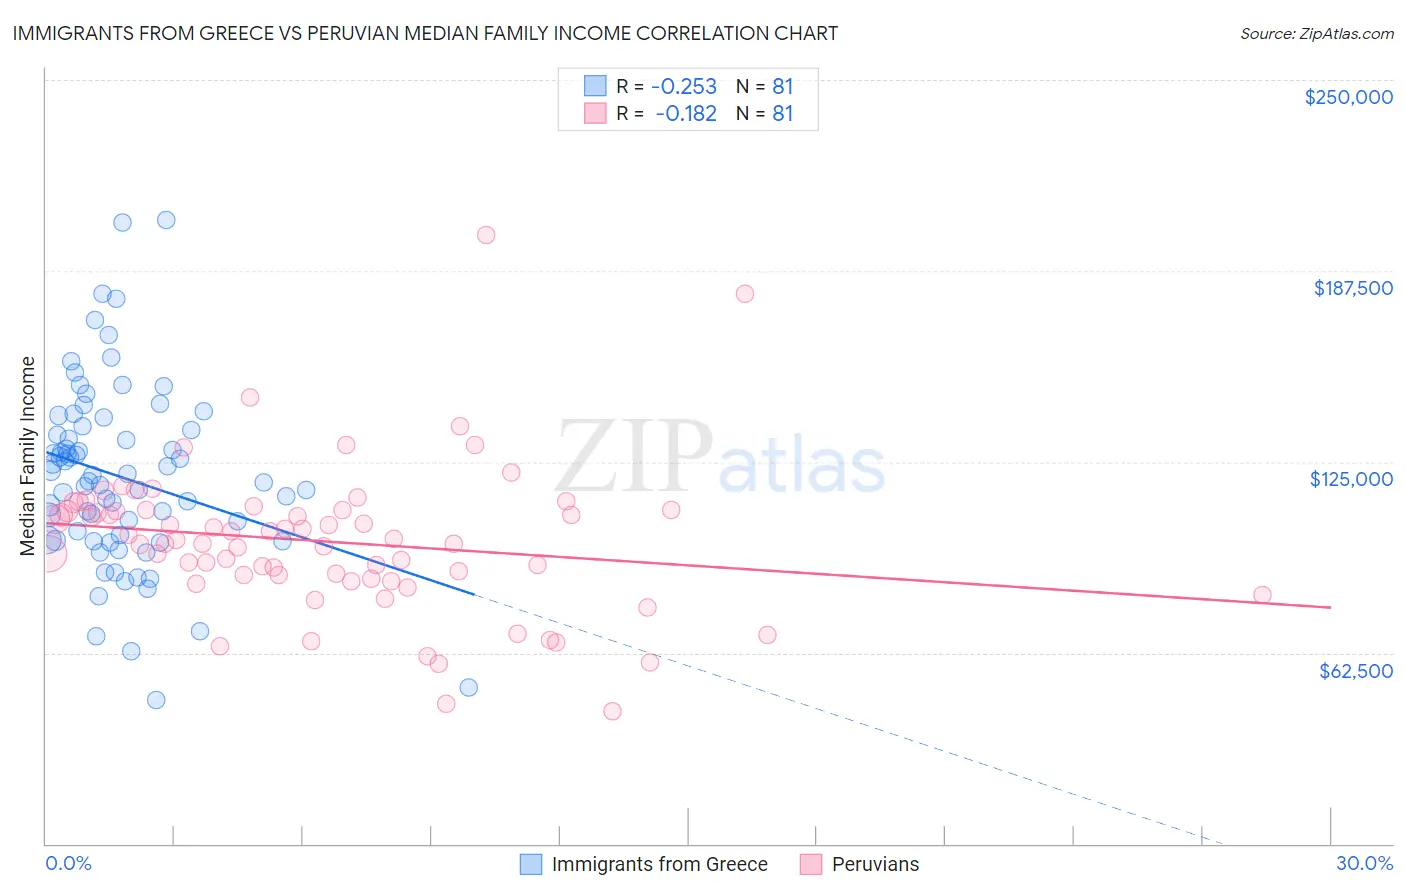
Immigrants from Greece vs Peruvian Median Family Income Correlation Chart
The statistical analysis conducted on geographies consisting of 216,841,936 people shows a weak negative correlation between the proportion of Immigrants from Greece and median family income in the United States with a correlation coefficient (R) of -0.253 and weighted average of $117,344. Similarly, the statistical analysis conducted on geographies consisting of 362,843,990 people shows a poor negative correlation between the proportion of Peruvians and median family income in the United States with a correlation coefficient (R) of -0.182 and weighted average of $105,444, a difference of 11.3%.
Median Family Income Correlation Summary
| Measurement | Immigrants from Greece | Peruvian |
| Minimum | $46,875 | $43,482 |
| Maximum | $204,250 | $199,297 |
| Range | $157,375 | $155,815 |
| Mean | $119,942 | $98,972 |
| Median | $118,534 | $99,243 |
| Interquartile 25% (IQ1) | $99,330 | $87,340 |
| Interquartile 75% (IQ3) | $136,059 | $109,266 |
| Interquartile Range (IQR) | $36,729 | $21,927 |
| Standard Deviation (Sample) | $29,797 | $24,295 |
| Standard Deviation (Population) | $29,612 | $24,144 |
Similar Demographics by Median Family Income
Demographics Similar to Immigrants from Greece by Median Family Income
In terms of median family income, the demographic groups most similar to Immigrants from Greece are Immigrants from Russia ($116,942, a difference of 0.34%), Cambodian ($117,780, a difference of 0.37%), Bulgarian ($117,818, a difference of 0.40%), Immigrants from Austria ($116,830, a difference of 0.44%), and Immigrants from Bolivia ($117,912, a difference of 0.48%).
| Demographics | Rating | Rank | Median Family Income |
| Immigrants | Turkey | 100.0 /100 | #38 | Exceptional $118,325 |
| Immigrants | Asia | 100.0 /100 | #39 | Exceptional $118,291 |
| Immigrants | Lithuania | 100.0 /100 | #40 | Exceptional $118,053 |
| Estonians | 100.0 /100 | #41 | Exceptional $118,013 |
| Immigrants | Bolivia | 100.0 /100 | #42 | Exceptional $117,912 |
| Bulgarians | 100.0 /100 | #43 | Exceptional $117,818 |
| Cambodians | 100.0 /100 | #44 | Exceptional $117,780 |
| Immigrants | Greece | 99.9 /100 | #45 | Exceptional $117,344 |
| Immigrants | Russia | 99.9 /100 | #46 | Exceptional $116,942 |
| Immigrants | Austria | 99.9 /100 | #47 | Exceptional $116,830 |
| Immigrants | South Africa | 99.9 /100 | #48 | Exceptional $116,286 |
| Chinese | 99.9 /100 | #49 | Exceptional $116,188 |
| Immigrants | Czechoslovakia | 99.9 /100 | #50 | Exceptional $116,165 |
| Immigrants | Malaysia | 99.9 /100 | #51 | Exceptional $115,880 |
| Maltese | 99.9 /100 | #52 | Exceptional $115,862 |
Demographics Similar to Peruvians by Median Family Income
In terms of median family income, the demographic groups most similar to Peruvians are Irish ($105,453, a difference of 0.010%), Immigrants from Germany ($105,507, a difference of 0.060%), Immigrants from Albania ($105,285, a difference of 0.15%), Hungarian ($105,609, a difference of 0.16%), and Immigrants from Chile ($105,655, a difference of 0.20%).
| Demographics | Rating | Rank | Median Family Income |
| Immigrants | Morocco | 84.3 /100 | #144 | Excellent $105,964 |
| Danes | 83.8 /100 | #145 | Excellent $105,900 |
| Czechs | 83.4 /100 | #146 | Excellent $105,839 |
| Immigrants | Chile | 82.1 /100 | #147 | Excellent $105,655 |
| Hungarians | 81.7 /100 | #148 | Excellent $105,609 |
| Immigrants | Germany | 80.9 /100 | #149 | Excellent $105,507 |
| Irish | 80.5 /100 | #150 | Excellent $105,453 |
| Peruvians | 80.4 /100 | #151 | Excellent $105,444 |
| Immigrants | Albania | 79.1 /100 | #152 | Good $105,285 |
| Slavs | 77.9 /100 | #153 | Good $105,144 |
| Immigrants | Nepal | 76.3 /100 | #154 | Good $104,966 |
| Native Hawaiians | 75.8 /100 | #155 | Good $104,910 |
| Basques | 74.4 /100 | #156 | Good $104,760 |
| Moroccans | 71.6 /100 | #157 | Good $104,488 |
| Scandinavians | 70.8 /100 | #158 | Good $104,410 |