Pueblo vs Peruvian Median Family Income
COMPARE
Pueblo
Peruvian
Median Family Income
Median Family Income Comparison
Pueblo
Peruvians
$76,880
MEDIAN FAMILY INCOME
0.0/ 100
METRIC RATING
341st/ 347
METRIC RANK
$105,444
MEDIAN FAMILY INCOME
80.4/ 100
METRIC RATING
151st/ 347
METRIC RANK
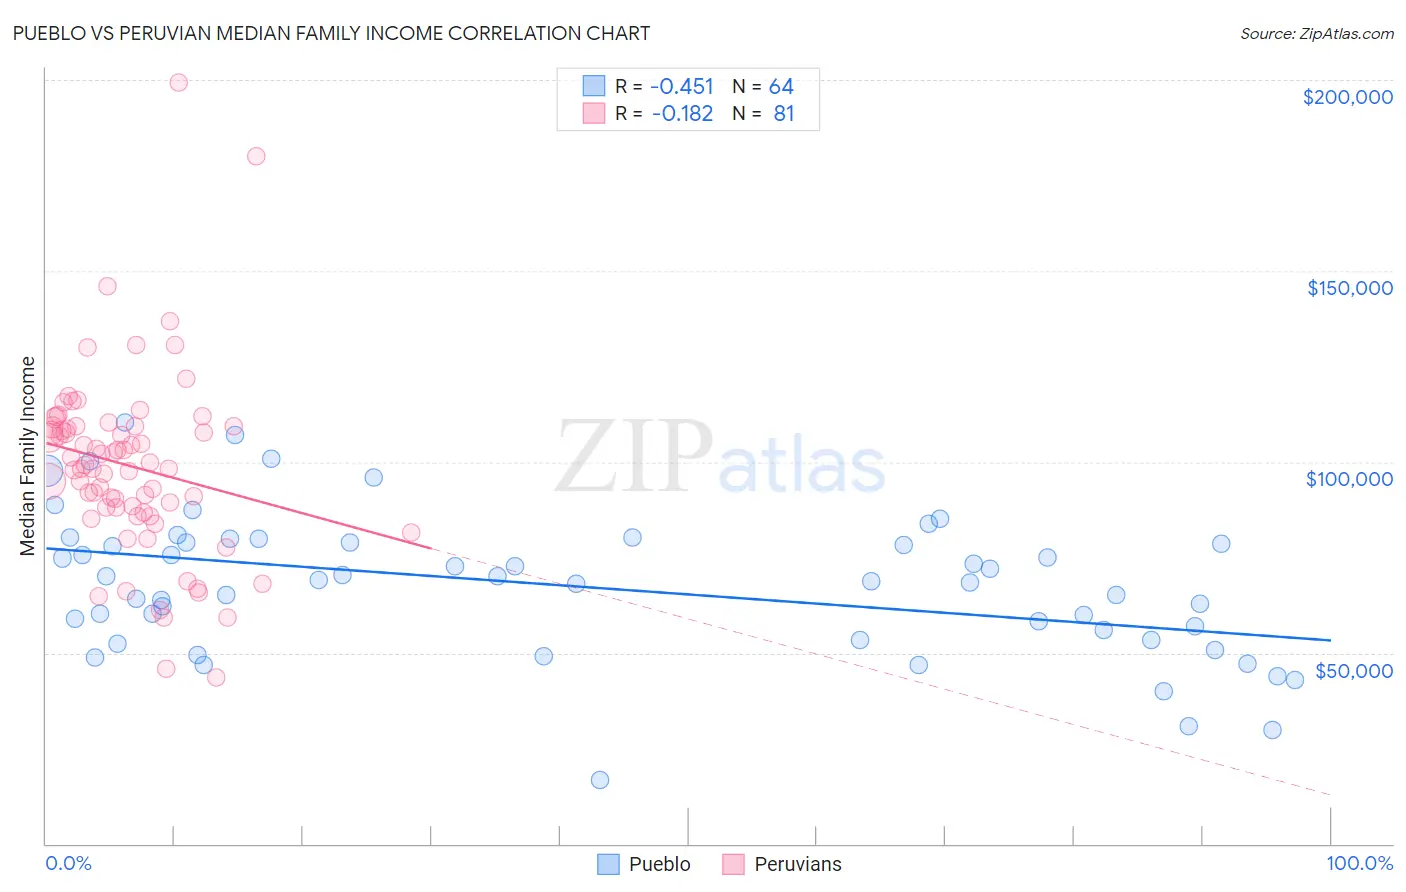
Pueblo vs Peruvian Median Family Income Correlation Chart
The statistical analysis conducted on geographies consisting of 120,047,767 people shows a moderate negative correlation between the proportion of Pueblo and median family income in the United States with a correlation coefficient (R) of -0.451 and weighted average of $76,880. Similarly, the statistical analysis conducted on geographies consisting of 362,843,990 people shows a poor negative correlation between the proportion of Peruvians and median family income in the United States with a correlation coefficient (R) of -0.182 and weighted average of $105,444, a difference of 37.1%.
Median Family Income Correlation Summary
| Measurement | Pueblo | Peruvian |
| Minimum | $16,806 | $43,482 |
| Maximum | $110,375 | $199,297 |
| Range | $93,569 | $155,815 |
| Mean | $67,508 | $98,972 |
| Median | $68,832 | $99,243 |
| Interquartile 25% (IQ1) | $54,583 | $87,340 |
| Interquartile 75% (IQ3) | $78,820 | $109,266 |
| Interquartile Range (IQR) | $24,237 | $21,927 |
| Standard Deviation (Sample) | $18,534 | $24,295 |
| Standard Deviation (Population) | $18,389 | $24,144 |
Similar Demographics by Median Family Income
Demographics Similar to Pueblo by Median Family Income
In terms of median family income, the demographic groups most similar to Pueblo are Crow ($76,605, a difference of 0.36%), Hopi ($77,188, a difference of 0.40%), Pima ($77,431, a difference of 0.72%), Immigrants from Yemen ($77,457, a difference of 0.75%), and Houma ($76,188, a difference of 0.91%).
| Demographics | Rating | Rank | Median Family Income |
| Kiowa | 0.0 /100 | #333 | Tragic $80,885 |
| Menominee | 0.0 /100 | #334 | Tragic $79,563 |
| Yup'ik | 0.0 /100 | #335 | Tragic $79,290 |
| Immigrants | Cuba | 0.0 /100 | #336 | Tragic $78,249 |
| Yuman | 0.0 /100 | #337 | Tragic $78,055 |
| Immigrants | Yemen | 0.0 /100 | #338 | Tragic $77,457 |
| Pima | 0.0 /100 | #339 | Tragic $77,431 |
| Hopi | 0.0 /100 | #340 | Tragic $77,188 |
| Pueblo | 0.0 /100 | #341 | Tragic $76,880 |
| Crow | 0.0 /100 | #342 | Tragic $76,605 |
| Houma | 0.0 /100 | #343 | Tragic $76,188 |
| Tohono O'odham | 0.0 /100 | #344 | Tragic $72,193 |
| Navajo | 0.0 /100 | #345 | Tragic $70,989 |
| Puerto Ricans | 0.0 /100 | #346 | Tragic $70,423 |
| Lumbee | 0.0 /100 | #347 | Tragic $68,679 |
Demographics Similar to Peruvians by Median Family Income
In terms of median family income, the demographic groups most similar to Peruvians are Irish ($105,453, a difference of 0.010%), Immigrants from Germany ($105,507, a difference of 0.060%), Immigrants from Albania ($105,285, a difference of 0.15%), Hungarian ($105,609, a difference of 0.16%), and Immigrants from Chile ($105,655, a difference of 0.20%).
| Demographics | Rating | Rank | Median Family Income |
| Immigrants | Morocco | 84.3 /100 | #144 | Excellent $105,964 |
| Danes | 83.8 /100 | #145 | Excellent $105,900 |
| Czechs | 83.4 /100 | #146 | Excellent $105,839 |
| Immigrants | Chile | 82.1 /100 | #147 | Excellent $105,655 |
| Hungarians | 81.7 /100 | #148 | Excellent $105,609 |
| Immigrants | Germany | 80.9 /100 | #149 | Excellent $105,507 |
| Irish | 80.5 /100 | #150 | Excellent $105,453 |
| Peruvians | 80.4 /100 | #151 | Excellent $105,444 |
| Immigrants | Albania | 79.1 /100 | #152 | Good $105,285 |
| Slavs | 77.9 /100 | #153 | Good $105,144 |
| Immigrants | Nepal | 76.3 /100 | #154 | Good $104,966 |
| Native Hawaiians | 75.8 /100 | #155 | Good $104,910 |
| Basques | 74.4 /100 | #156 | Good $104,760 |
| Moroccans | 71.6 /100 | #157 | Good $104,488 |
| Scandinavians | 70.8 /100 | #158 | Good $104,410 |