Immigrants from Uzbekistan vs Peruvian Median Family Income
COMPARE
Immigrants from Uzbekistan
Peruvian
Median Family Income
Median Family Income Comparison
Immigrants from Uzbekistan
Peruvians
$103,197
MEDIAN FAMILY INCOME
56.6/ 100
METRIC RATING
170th/ 347
METRIC RANK
$105,444
MEDIAN FAMILY INCOME
80.4/ 100
METRIC RATING
151st/ 347
METRIC RANK
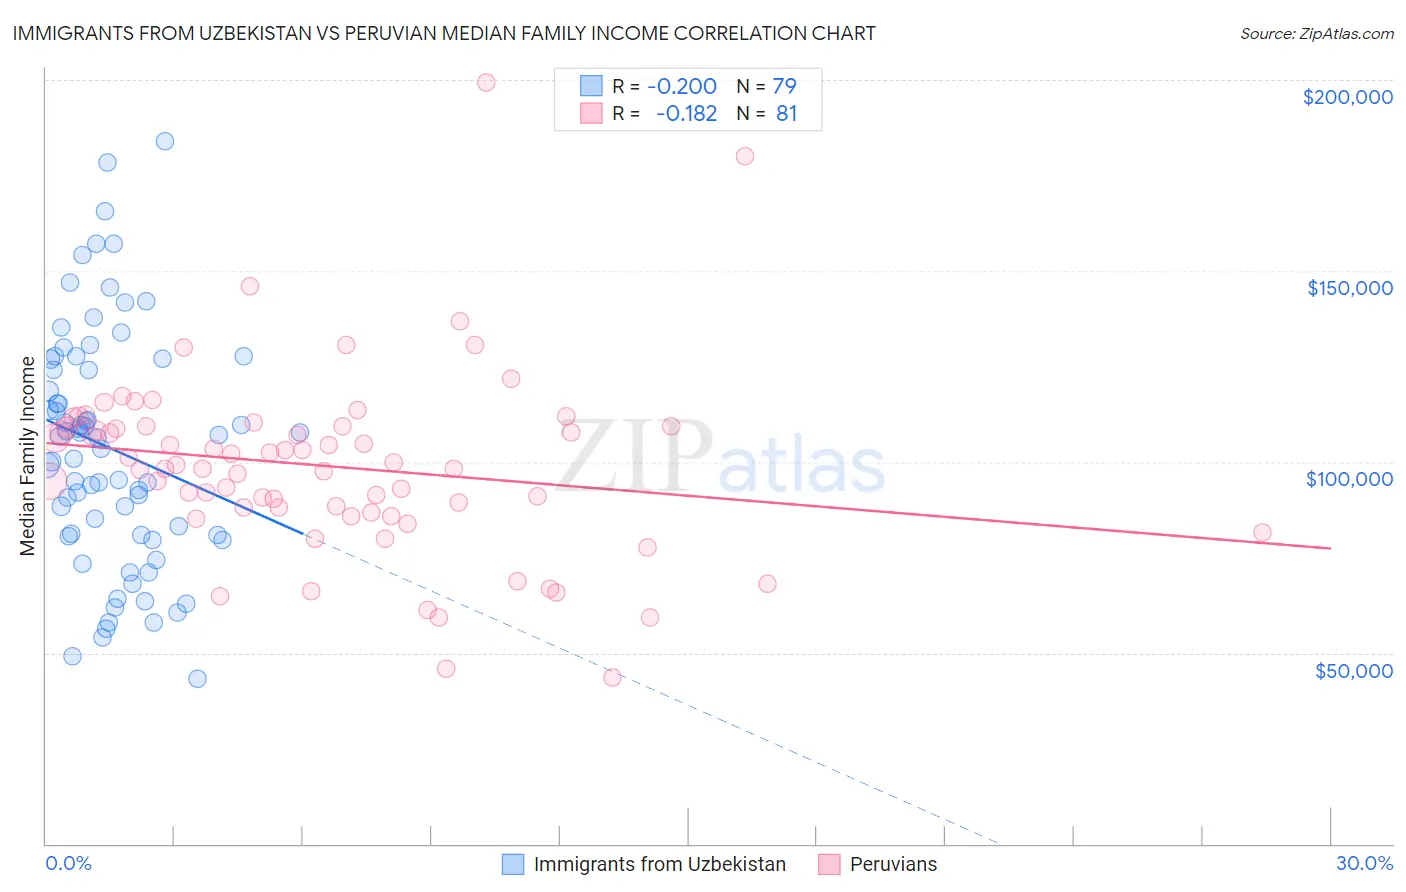
Immigrants from Uzbekistan vs Peruvian Median Family Income Correlation Chart
The statistical analysis conducted on geographies consisting of 118,698,354 people shows a poor negative correlation between the proportion of Immigrants from Uzbekistan and median family income in the United States with a correlation coefficient (R) of -0.200 and weighted average of $103,197. Similarly, the statistical analysis conducted on geographies consisting of 362,843,990 people shows a poor negative correlation between the proportion of Peruvians and median family income in the United States with a correlation coefficient (R) of -0.182 and weighted average of $105,444, a difference of 2.2%.
Median Family Income Correlation Summary
| Measurement | Immigrants from Uzbekistan | Peruvian |
| Minimum | $43,333 | $43,482 |
| Maximum | $184,083 | $199,297 |
| Range | $140,750 | $155,815 |
| Mean | $103,479 | $98,972 |
| Median | $106,438 | $99,243 |
| Interquartile 25% (IQ1) | $80,707 | $87,340 |
| Interquartile 75% (IQ3) | $126,877 | $109,266 |
| Interquartile Range (IQR) | $46,170 | $21,927 |
| Standard Deviation (Sample) | $30,925 | $24,295 |
| Standard Deviation (Population) | $30,729 | $24,144 |
Demographics Similar to Immigrants from Uzbekistan and Peruvians by Median Family Income
In terms of median family income, the demographic groups most similar to Immigrants from Uzbekistan are Czechoslovakian ($103,273, a difference of 0.070%), Immigrants from Peru ($103,534, a difference of 0.33%), South American Indian ($103,624, a difference of 0.41%), English ($103,684, a difference of 0.47%), and Slovak ($103,729, a difference of 0.52%). Similarly, the demographic groups most similar to Peruvians are Irish ($105,453, a difference of 0.010%), Immigrants from Albania ($105,285, a difference of 0.15%), Slavic ($105,144, a difference of 0.28%), Immigrants from Nepal ($104,966, a difference of 0.45%), and Native Hawaiian ($104,910, a difference of 0.51%).
| Demographics | Rating | Rank | Median Family Income |
| Irish | 80.5 /100 | #150 | Excellent $105,453 |
| Peruvians | 80.4 /100 | #151 | Excellent $105,444 |
| Immigrants | Albania | 79.1 /100 | #152 | Good $105,285 |
| Slavs | 77.9 /100 | #153 | Good $105,144 |
| Immigrants | Nepal | 76.3 /100 | #154 | Good $104,966 |
| Native Hawaiians | 75.8 /100 | #155 | Good $104,910 |
| Basques | 74.4 /100 | #156 | Good $104,760 |
| Moroccans | 71.6 /100 | #157 | Good $104,488 |
| Scandinavians | 70.8 /100 | #158 | Good $104,410 |
| Swiss | 70.7 /100 | #159 | Good $104,396 |
| Scottish | 69.5 /100 | #160 | Good $104,288 |
| Icelanders | 69.4 /100 | #161 | Good $104,282 |
| Immigrants | Sierra Leone | 66.2 /100 | #162 | Good $103,990 |
| Costa Ricans | 66.2 /100 | #163 | Good $103,989 |
| Sierra Leoneans | 64.7 /100 | #164 | Good $103,859 |
| Slovaks | 63.1 /100 | #165 | Good $103,729 |
| English | 62.6 /100 | #166 | Good $103,684 |
| South American Indians | 61.9 /100 | #167 | Good $103,624 |
| Immigrants | Peru | 60.8 /100 | #168 | Good $103,534 |
| Czechoslovakians | 57.6 /100 | #169 | Average $103,273 |
| Immigrants | Uzbekistan | 56.6 /100 | #170 | Average $103,197 |