Immigrants from Turkey vs Immigrants from El Salvador Householder Income Ages 25 - 44 years
COMPARE
Immigrants from Turkey
Immigrants from El Salvador
Householder Income Ages 25 - 44 years
Householder Income Ages 25 - 44 years Comparison
Immigrants from Turkey
Immigrants from El Salvador
$107,258
HOUSEHOLDER INCOME AGES 25 - 44 YEARS
99.9/ 100
METRIC RATING
49th/ 347
METRIC RANK
$86,913
HOUSEHOLDER INCOME AGES 25 - 44 YEARS
1.4/ 100
METRIC RATING
245th/ 347
METRIC RANK
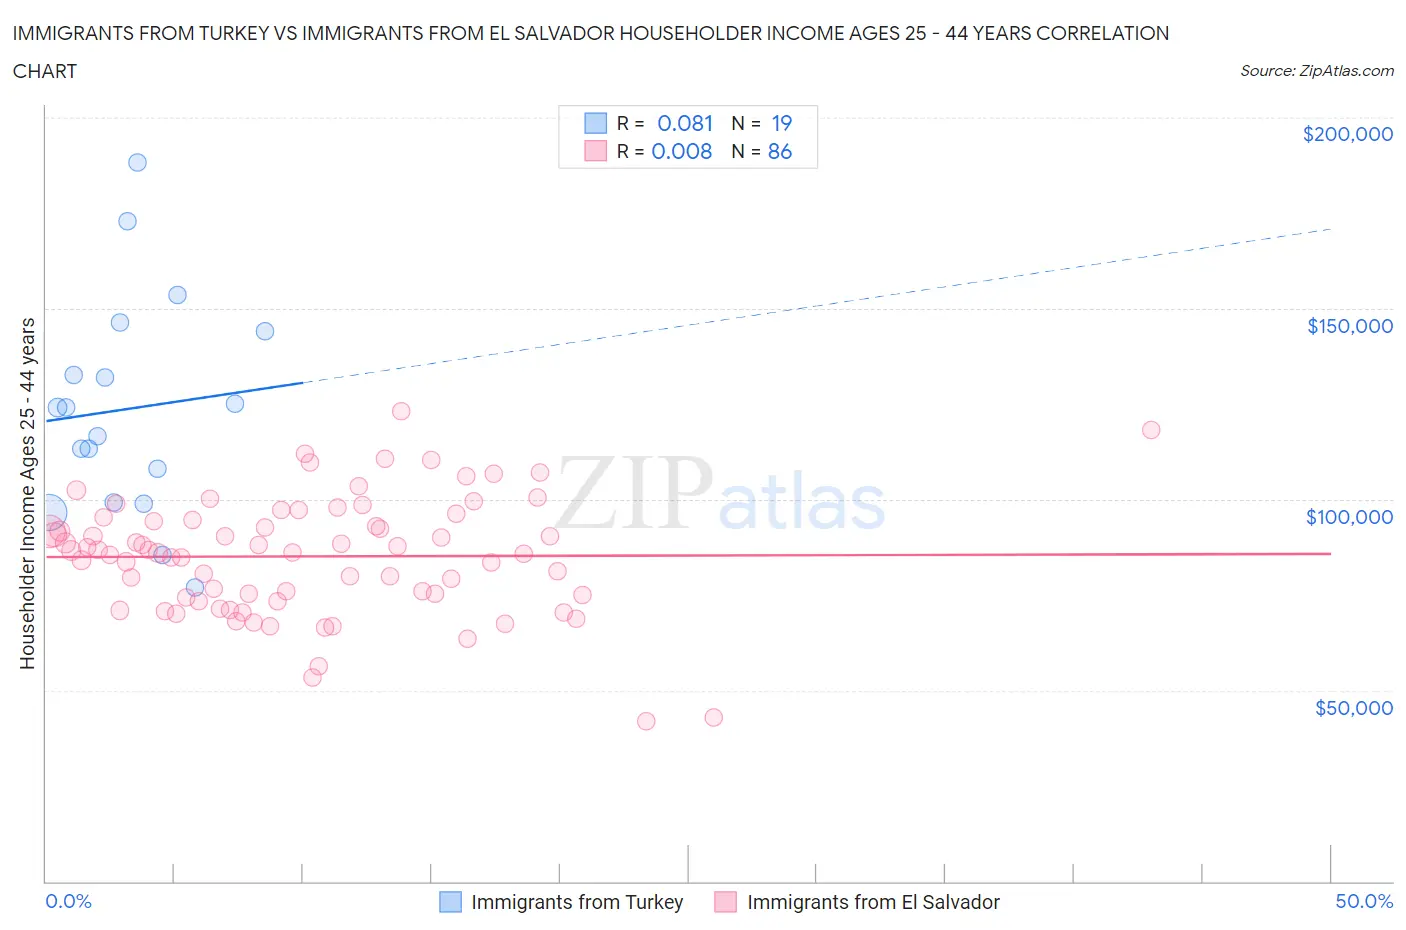
Immigrants from Turkey vs Immigrants from El Salvador Householder Income Ages 25 - 44 years Correlation Chart
The statistical analysis conducted on geographies consisting of 222,801,410 people shows a slight positive correlation between the proportion of Immigrants from Turkey and household income with householder between the ages 25 and 44 in the United States with a correlation coefficient (R) of 0.081 and weighted average of $107,258. Similarly, the statistical analysis conducted on geographies consisting of 357,268,727 people shows no correlation between the proportion of Immigrants from El Salvador and household income with householder between the ages 25 and 44 in the United States with a correlation coefficient (R) of 0.008 and weighted average of $86,913, a difference of 23.4%.
Householder Income Ages 25 - 44 years Correlation Summary
| Measurement | Immigrants from Turkey | Immigrants from El Salvador |
| Minimum | $76,806 | $41,962 |
| Maximum | $188,366 | $123,232 |
| Range | $111,560 | $81,270 |
| Mean | $123,727 | $85,059 |
| Median | $124,014 | $86,368 |
| Interquartile 25% (IQ1) | $99,024 | $74,423 |
| Interquartile 75% (IQ3) | $144,167 | $94,628 |
| Interquartile Range (IQR) | $45,143 | $20,205 |
| Standard Deviation (Sample) | $28,597 | $15,431 |
| Standard Deviation (Population) | $27,834 | $15,341 |
Similar Demographics by Householder Income Ages 25 - 44 years
Demographics Similar to Immigrants from Turkey by Householder Income Ages 25 - 44 years
In terms of householder income ages 25 - 44 years, the demographic groups most similar to Immigrants from Turkey are Estonian ($107,269, a difference of 0.010%), Bulgarian ($107,264, a difference of 0.010%), Cambodian ($107,148, a difference of 0.10%), Immigrants from Belarus ($107,393, a difference of 0.13%), and Israeli ($107,579, a difference of 0.30%).
| Demographics | Rating | Rank | Householder Income Ages 25 - 44 years |
| Australians | 99.9 /100 | #42 | Exceptional $107,912 |
| Immigrants | Malaysia | 99.9 /100 | #43 | Exceptional $107,650 |
| Immigrants | Indonesia | 99.9 /100 | #44 | Exceptional $107,627 |
| Israelis | 99.9 /100 | #45 | Exceptional $107,579 |
| Immigrants | Belarus | 99.9 /100 | #46 | Exceptional $107,393 |
| Estonians | 99.9 /100 | #47 | Exceptional $107,269 |
| Bulgarians | 99.9 /100 | #48 | Exceptional $107,264 |
| Immigrants | Turkey | 99.9 /100 | #49 | Exceptional $107,258 |
| Cambodians | 99.9 /100 | #50 | Exceptional $107,148 |
| Immigrants | Czechoslovakia | 99.9 /100 | #51 | Exceptional $106,888 |
| Immigrants | Europe | 99.9 /100 | #52 | Exceptional $106,817 |
| Immigrants | Norway | 99.9 /100 | #53 | Exceptional $106,629 |
| Paraguayans | 99.9 /100 | #54 | Exceptional $106,615 |
| Greeks | 99.9 /100 | #55 | Exceptional $106,457 |
| Immigrants | Pakistan | 99.8 /100 | #56 | Exceptional $106,129 |
Demographics Similar to Immigrants from El Salvador by Householder Income Ages 25 - 44 years
In terms of householder income ages 25 - 44 years, the demographic groups most similar to Immigrants from El Salvador are Immigrants from Venezuela ($87,038, a difference of 0.14%), Immigrants from West Indies ($87,063, a difference of 0.17%), Immigrants from Burma/Myanmar ($86,736, a difference of 0.20%), West Indian ($87,205, a difference of 0.34%), and Immigrants from Nigeria ($86,589, a difference of 0.37%).
| Demographics | Rating | Rank | Householder Income Ages 25 - 44 years |
| Alaska Natives | 2.6 /100 | #238 | Tragic $88,018 |
| Immigrants | Ghana | 2.2 /100 | #239 | Tragic $87,760 |
| Nicaraguans | 2.2 /100 | #240 | Tragic $87,751 |
| Nigerians | 2.2 /100 | #241 | Tragic $87,730 |
| West Indians | 1.7 /100 | #242 | Tragic $87,205 |
| Immigrants | West Indies | 1.5 /100 | #243 | Tragic $87,063 |
| Immigrants | Venezuela | 1.5 /100 | #244 | Tragic $87,038 |
| Immigrants | El Salvador | 1.4 /100 | #245 | Tragic $86,913 |
| Immigrants | Burma/Myanmar | 1.3 /100 | #246 | Tragic $86,736 |
| Immigrants | Nigeria | 1.2 /100 | #247 | Tragic $86,589 |
| Immigrants | Sudan | 0.9 /100 | #248 | Tragic $86,109 |
| French American Indians | 0.8 /100 | #249 | Tragic $85,899 |
| Pennsylvania Germans | 0.8 /100 | #250 | Tragic $85,836 |
| Cape Verdeans | 0.8 /100 | #251 | Tragic $85,758 |
| Immigrants | Western Africa | 0.7 /100 | #252 | Tragic $85,676 |