Immigrants from Turkey vs Immigrants from Laos Householder Income Ages 25 - 44 years
COMPARE
Immigrants from Turkey
Immigrants from Laos
Householder Income Ages 25 - 44 years
Householder Income Ages 25 - 44 years Comparison
Immigrants from Turkey
Immigrants from Laos
$107,258
HOUSEHOLDER INCOME AGES 25 - 44 YEARS
99.9/ 100
METRIC RATING
49th/ 347
METRIC RANK
$85,553
HOUSEHOLDER INCOME AGES 25 - 44 YEARS
0.7/ 100
METRIC RATING
254th/ 347
METRIC RANK
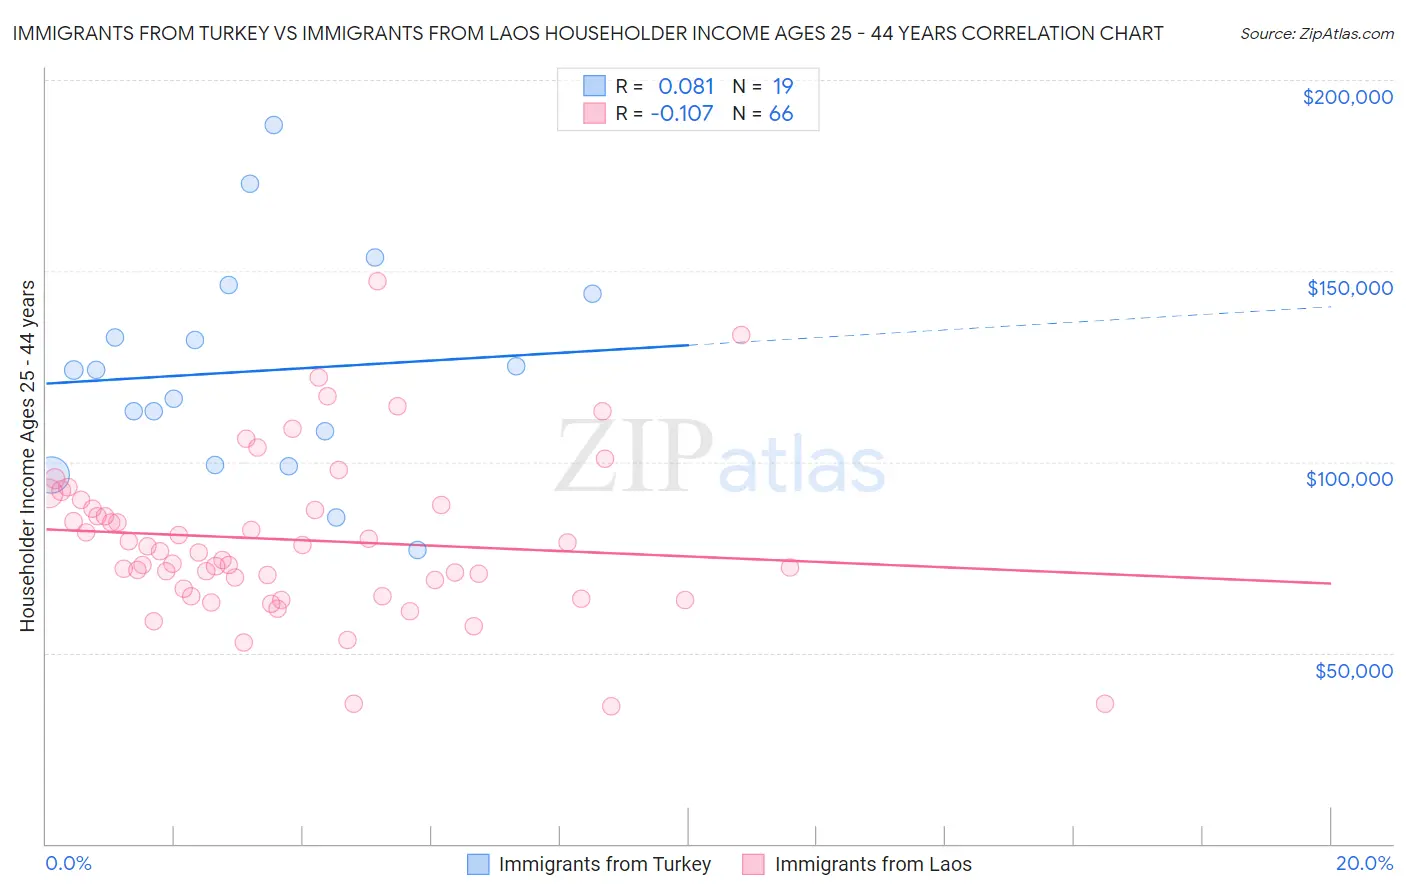
Immigrants from Turkey vs Immigrants from Laos Householder Income Ages 25 - 44 years Correlation Chart
The statistical analysis conducted on geographies consisting of 222,801,410 people shows a slight positive correlation between the proportion of Immigrants from Turkey and household income with householder between the ages 25 and 44 in the United States with a correlation coefficient (R) of 0.081 and weighted average of $107,258. Similarly, the statistical analysis conducted on geographies consisting of 201,332,387 people shows a poor negative correlation between the proportion of Immigrants from Laos and household income with householder between the ages 25 and 44 in the United States with a correlation coefficient (R) of -0.107 and weighted average of $85,553, a difference of 25.4%.
Householder Income Ages 25 - 44 years Correlation Summary
| Measurement | Immigrants from Turkey | Immigrants from Laos |
| Minimum | $76,806 | $36,106 |
| Maximum | $188,366 | $147,348 |
| Range | $111,560 | $111,242 |
| Mean | $123,727 | $79,556 |
| Median | $124,014 | $76,403 |
| Interquartile 25% (IQ1) | $99,024 | $66,885 |
| Interquartile 75% (IQ3) | $144,167 | $88,750 |
| Interquartile Range (IQR) | $45,143 | $21,865 |
| Standard Deviation (Sample) | $28,597 | $21,017 |
| Standard Deviation (Population) | $27,834 | $20,857 |
Similar Demographics by Householder Income Ages 25 - 44 years
Demographics Similar to Immigrants from Turkey by Householder Income Ages 25 - 44 years
In terms of householder income ages 25 - 44 years, the demographic groups most similar to Immigrants from Turkey are Estonian ($107,269, a difference of 0.010%), Bulgarian ($107,264, a difference of 0.010%), Cambodian ($107,148, a difference of 0.10%), Immigrants from Belarus ($107,393, a difference of 0.13%), and Israeli ($107,579, a difference of 0.30%).
| Demographics | Rating | Rank | Householder Income Ages 25 - 44 years |
| Australians | 99.9 /100 | #42 | Exceptional $107,912 |
| Immigrants | Malaysia | 99.9 /100 | #43 | Exceptional $107,650 |
| Immigrants | Indonesia | 99.9 /100 | #44 | Exceptional $107,627 |
| Israelis | 99.9 /100 | #45 | Exceptional $107,579 |
| Immigrants | Belarus | 99.9 /100 | #46 | Exceptional $107,393 |
| Estonians | 99.9 /100 | #47 | Exceptional $107,269 |
| Bulgarians | 99.9 /100 | #48 | Exceptional $107,264 |
| Immigrants | Turkey | 99.9 /100 | #49 | Exceptional $107,258 |
| Cambodians | 99.9 /100 | #50 | Exceptional $107,148 |
| Immigrants | Czechoslovakia | 99.9 /100 | #51 | Exceptional $106,888 |
| Immigrants | Europe | 99.9 /100 | #52 | Exceptional $106,817 |
| Immigrants | Norway | 99.9 /100 | #53 | Exceptional $106,629 |
| Paraguayans | 99.9 /100 | #54 | Exceptional $106,615 |
| Greeks | 99.9 /100 | #55 | Exceptional $106,457 |
| Immigrants | Pakistan | 99.8 /100 | #56 | Exceptional $106,129 |
Demographics Similar to Immigrants from Laos by Householder Income Ages 25 - 44 years
In terms of householder income ages 25 - 44 years, the demographic groups most similar to Immigrants from Laos are British West Indian ($85,565, a difference of 0.010%), Immigrants from Western Africa ($85,676, a difference of 0.14%), Cape Verdean ($85,758, a difference of 0.24%), Pennsylvania German ($85,836, a difference of 0.33%), and German Russian ($85,220, a difference of 0.39%).
| Demographics | Rating | Rank | Householder Income Ages 25 - 44 years |
| Immigrants | Nigeria | 1.2 /100 | #247 | Tragic $86,589 |
| Immigrants | Sudan | 0.9 /100 | #248 | Tragic $86,109 |
| French American Indians | 0.8 /100 | #249 | Tragic $85,899 |
| Pennsylvania Germans | 0.8 /100 | #250 | Tragic $85,836 |
| Cape Verdeans | 0.8 /100 | #251 | Tragic $85,758 |
| Immigrants | Western Africa | 0.7 /100 | #252 | Tragic $85,676 |
| British West Indians | 0.7 /100 | #253 | Tragic $85,565 |
| Immigrants | Laos | 0.7 /100 | #254 | Tragic $85,553 |
| German Russians | 0.6 /100 | #255 | Tragic $85,220 |
| Central Americans | 0.5 /100 | #256 | Tragic $85,144 |
| Mexican American Indians | 0.5 /100 | #257 | Tragic $85,066 |
| Immigrants | Nicaragua | 0.5 /100 | #258 | Tragic $84,914 |
| Immigrants | Senegal | 0.5 /100 | #259 | Tragic $84,848 |
| Americans | 0.4 /100 | #260 | Tragic $84,791 |
| Inupiat | 0.4 /100 | #261 | Tragic $84,619 |