Immigrants from Turkey vs Immigrants from Argentina Householder Income Ages 25 - 44 years
COMPARE
Immigrants from Turkey
Immigrants from Argentina
Householder Income Ages 25 - 44 years
Householder Income Ages 25 - 44 years Comparison
Immigrants from Turkey
Immigrants from Argentina
$107,258
HOUSEHOLDER INCOME AGES 25 - 44 YEARS
99.9/ 100
METRIC RATING
49th/ 347
METRIC RANK
$101,415
HOUSEHOLDER INCOME AGES 25 - 44 YEARS
97.8/ 100
METRIC RATING
100th/ 347
METRIC RANK
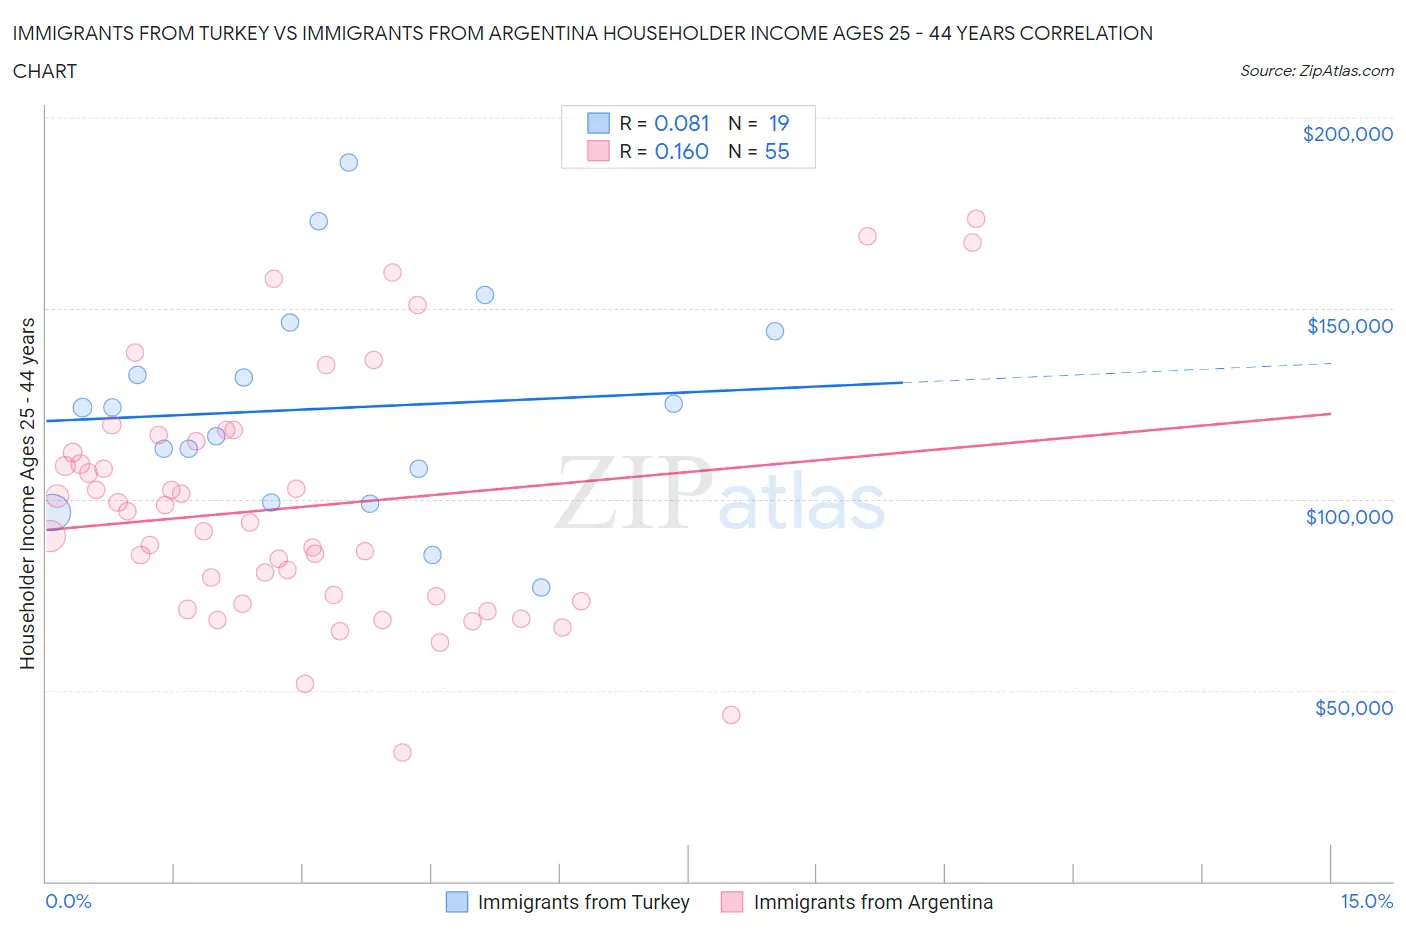
Immigrants from Turkey vs Immigrants from Argentina Householder Income Ages 25 - 44 years Correlation Chart
The statistical analysis conducted on geographies consisting of 222,801,410 people shows a slight positive correlation between the proportion of Immigrants from Turkey and household income with householder between the ages 25 and 44 in the United States with a correlation coefficient (R) of 0.081 and weighted average of $107,258. Similarly, the statistical analysis conducted on geographies consisting of 264,114,955 people shows a poor positive correlation between the proportion of Immigrants from Argentina and household income with householder between the ages 25 and 44 in the United States with a correlation coefficient (R) of 0.160 and weighted average of $101,415, a difference of 5.8%.
Householder Income Ages 25 - 44 years Correlation Summary
| Measurement | Immigrants from Turkey | Immigrants from Argentina |
| Minimum | $76,806 | $33,750 |
| Maximum | $188,366 | $173,409 |
| Range | $111,560 | $139,659 |
| Mean | $123,727 | $98,084 |
| Median | $124,014 | $93,801 |
| Interquartile 25% (IQ1) | $99,024 | $73,173 |
| Interquartile 75% (IQ3) | $144,167 | $115,092 |
| Interquartile Range (IQR) | $45,143 | $41,919 |
| Standard Deviation (Sample) | $28,597 | $31,751 |
| Standard Deviation (Population) | $27,834 | $31,461 |
Similar Demographics by Householder Income Ages 25 - 44 years
Demographics Similar to Immigrants from Turkey by Householder Income Ages 25 - 44 years
In terms of householder income ages 25 - 44 years, the demographic groups most similar to Immigrants from Turkey are Estonian ($107,269, a difference of 0.010%), Bulgarian ($107,264, a difference of 0.010%), Cambodian ($107,148, a difference of 0.10%), Immigrants from Belarus ($107,393, a difference of 0.13%), and Israeli ($107,579, a difference of 0.30%).
| Demographics | Rating | Rank | Householder Income Ages 25 - 44 years |
| Australians | 99.9 /100 | #42 | Exceptional $107,912 |
| Immigrants | Malaysia | 99.9 /100 | #43 | Exceptional $107,650 |
| Immigrants | Indonesia | 99.9 /100 | #44 | Exceptional $107,627 |
| Israelis | 99.9 /100 | #45 | Exceptional $107,579 |
| Immigrants | Belarus | 99.9 /100 | #46 | Exceptional $107,393 |
| Estonians | 99.9 /100 | #47 | Exceptional $107,269 |
| Bulgarians | 99.9 /100 | #48 | Exceptional $107,264 |
| Immigrants | Turkey | 99.9 /100 | #49 | Exceptional $107,258 |
| Cambodians | 99.9 /100 | #50 | Exceptional $107,148 |
| Immigrants | Czechoslovakia | 99.9 /100 | #51 | Exceptional $106,888 |
| Immigrants | Europe | 99.9 /100 | #52 | Exceptional $106,817 |
| Immigrants | Norway | 99.9 /100 | #53 | Exceptional $106,629 |
| Paraguayans | 99.9 /100 | #54 | Exceptional $106,615 |
| Greeks | 99.9 /100 | #55 | Exceptional $106,457 |
| Immigrants | Pakistan | 99.8 /100 | #56 | Exceptional $106,129 |
Demographics Similar to Immigrants from Argentina by Householder Income Ages 25 - 44 years
In terms of householder income ages 25 - 44 years, the demographic groups most similar to Immigrants from Argentina are Albanian ($101,367, a difference of 0.050%), Taiwanese ($101,492, a difference of 0.080%), Immigrants from Lebanon ($101,124, a difference of 0.29%), Immigrants from Kazakhstan ($101,727, a difference of 0.31%), and Immigrants from Moldova ($101,091, a difference of 0.32%).
| Demographics | Rating | Rank | Householder Income Ages 25 - 44 years |
| Immigrants | England | 98.4 /100 | #93 | Exceptional $102,020 |
| Sri Lankans | 98.4 /100 | #94 | Exceptional $101,960 |
| Assyrians/Chaldeans/Syriacs | 98.3 /100 | #95 | Exceptional $101,936 |
| Macedonians | 98.3 /100 | #96 | Exceptional $101,882 |
| Austrians | 98.3 /100 | #97 | Exceptional $101,842 |
| Immigrants | Kazakhstan | 98.1 /100 | #98 | Exceptional $101,727 |
| Taiwanese | 97.9 /100 | #99 | Exceptional $101,492 |
| Immigrants | Argentina | 97.8 /100 | #100 | Exceptional $101,415 |
| Albanians | 97.8 /100 | #101 | Exceptional $101,367 |
| Immigrants | Lebanon | 97.4 /100 | #102 | Exceptional $101,124 |
| Immigrants | Moldova | 97.4 /100 | #103 | Exceptional $101,091 |
| Immigrants | Poland | 97.4 /100 | #104 | Exceptional $101,065 |
| Immigrants | Vietnam | 96.5 /100 | #105 | Exceptional $100,535 |
| Immigrants | Brazil | 96.5 /100 | #106 | Exceptional $100,534 |
| Northern Europeans | 96.3 /100 | #107 | Exceptional $100,457 |