Hispanic or Latino vs Immigrants from South Africa Householder Income Ages 45 - 64 years
COMPARE
Hispanic or Latino
Immigrants from South Africa
Householder Income Ages 45 - 64 years
Householder Income Ages 45 - 64 years Comparison
Hispanics or Latinos
Immigrants from South Africa
$86,006
HOUSEHOLDER INCOME AGES 45 - 64 YEARS
0.1/ 100
METRIC RATING
291st/ 347
METRIC RANK
$112,886
HOUSEHOLDER INCOME AGES 45 - 64 YEARS
99.8/ 100
METRIC RATING
51st/ 347
METRIC RANK
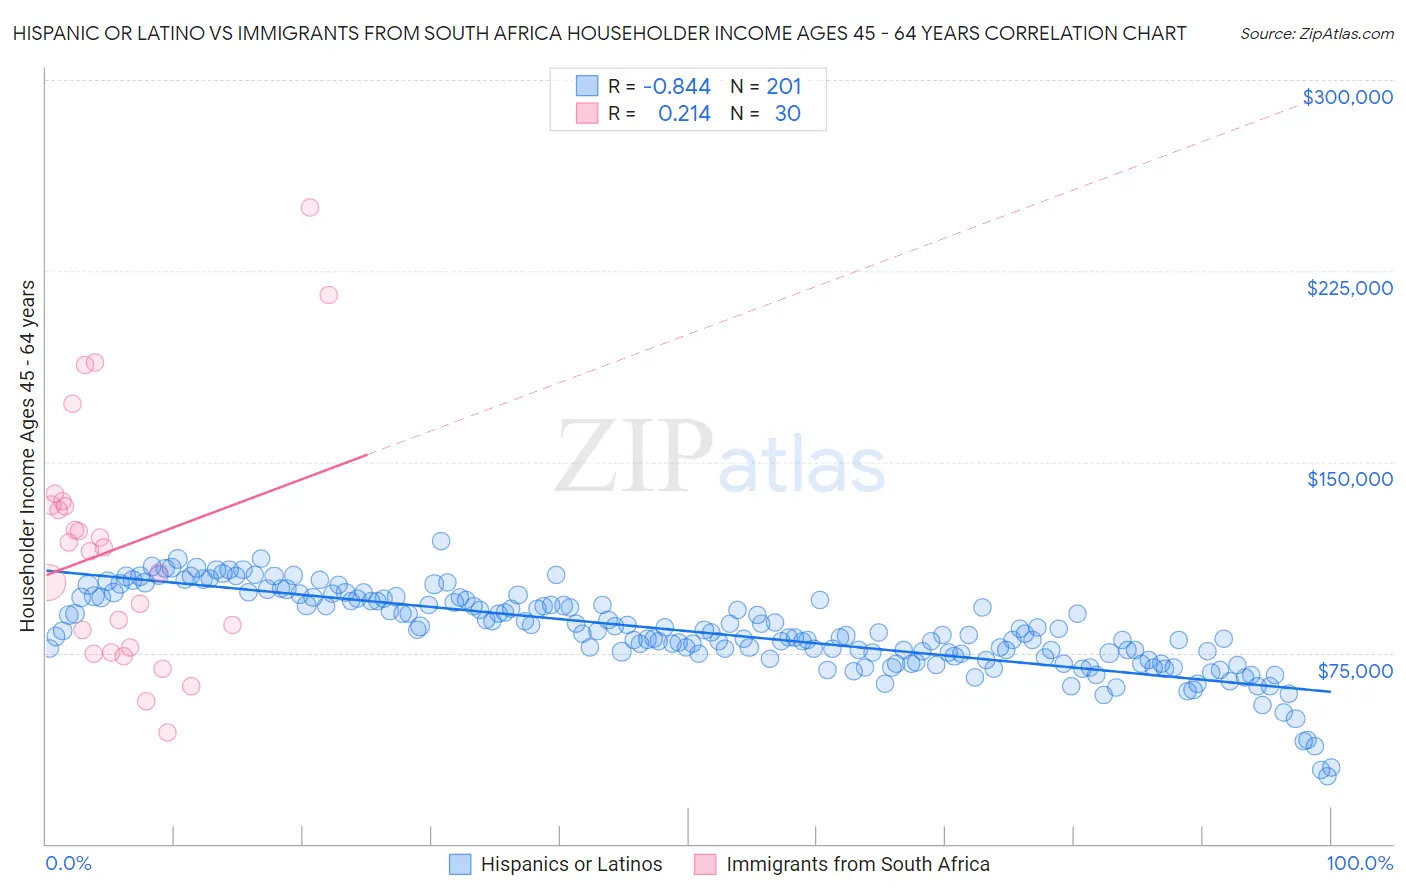
Hispanic or Latino vs Immigrants from South Africa Householder Income Ages 45 - 64 years Correlation Chart
The statistical analysis conducted on geographies consisting of 574,103,825 people shows a very strong negative correlation between the proportion of Hispanics or Latinos and household income with householder between the ages 45 and 64 in the United States with a correlation coefficient (R) of -0.844 and weighted average of $86,006. Similarly, the statistical analysis conducted on geographies consisting of 233,154,360 people shows a weak positive correlation between the proportion of Immigrants from South Africa and household income with householder between the ages 45 and 64 in the United States with a correlation coefficient (R) of 0.214 and weighted average of $112,886, a difference of 31.2%.
Householder Income Ages 45 - 64 years Correlation Summary
| Measurement | Hispanic or Latino | Immigrants from South Africa |
| Minimum | $26,626 | $43,750 |
| Maximum | $118,670 | $250,001 |
| Range | $92,045 | $206,251 |
| Mean | $83,367 | $116,416 |
| Median | $82,863 | $115,780 |
| Interquartile 25% (IQ1) | $74,106 | $77,125 |
| Interquartile 75% (IQ3) | $96,088 | $133,043 |
| Interquartile Range (IQR) | $21,982 | $55,918 |
| Standard Deviation (Sample) | $16,403 | $48,210 |
| Standard Deviation (Population) | $16,362 | $47,400 |
Similar Demographics by Householder Income Ages 45 - 64 years
Demographics Similar to Hispanics or Latinos by Householder Income Ages 45 - 64 years
In terms of householder income ages 45 - 64 years, the demographic groups most similar to Hispanics or Latinos are Immigrants from Central America ($85,965, a difference of 0.050%), Cherokee ($86,125, a difference of 0.14%), Comanche ($85,787, a difference of 0.25%), Cuban ($86,301, a difference of 0.34%), and Immigrants from St. Vincent and the Grenadines ($86,394, a difference of 0.45%).
| Demographics | Rating | Rank | Householder Income Ages 45 - 64 years |
| Central American Indians | 0.1 /100 | #284 | Tragic $86,764 |
| Blackfeet | 0.1 /100 | #285 | Tragic $86,595 |
| Immigrants | Guatemala | 0.1 /100 | #286 | Tragic $86,573 |
| Bangladeshis | 0.1 /100 | #287 | Tragic $86,402 |
| Immigrants | St. Vincent and the Grenadines | 0.1 /100 | #288 | Tragic $86,394 |
| Cubans | 0.1 /100 | #289 | Tragic $86,301 |
| Cherokee | 0.1 /100 | #290 | Tragic $86,125 |
| Hispanics or Latinos | 0.1 /100 | #291 | Tragic $86,006 |
| Immigrants | Central America | 0.1 /100 | #292 | Tragic $85,965 |
| Comanche | 0.1 /100 | #293 | Tragic $85,787 |
| British West Indians | 0.1 /100 | #294 | Tragic $85,571 |
| Immigrants | Grenada | 0.1 /100 | #295 | Tragic $85,552 |
| Immigrants | Zaire | 0.1 /100 | #296 | Tragic $85,207 |
| Fijians | 0.1 /100 | #297 | Tragic $85,187 |
| Africans | 0.0 /100 | #298 | Tragic $84,925 |
Demographics Similar to Immigrants from South Africa by Householder Income Ages 45 - 64 years
In terms of householder income ages 45 - 64 years, the demographic groups most similar to Immigrants from South Africa are Immigrants from Malaysia ($112,796, a difference of 0.080%), Afghan ($112,676, a difference of 0.19%), Immigrants from Austria ($113,140, a difference of 0.22%), Greek ($112,630, a difference of 0.23%), and Immigrants from Russia ($113,215, a difference of 0.29%).
| Demographics | Rating | Rank | Householder Income Ages 45 - 64 years |
| Bulgarians | 99.9 /100 | #44 | Exceptional $113,883 |
| Immigrants | France | 99.9 /100 | #45 | Exceptional $113,680 |
| Immigrants | Greece | 99.9 /100 | #46 | Exceptional $113,548 |
| Australians | 99.9 /100 | #47 | Exceptional $113,533 |
| Immigrants | Indonesia | 99.9 /100 | #48 | Exceptional $113,519 |
| Immigrants | Russia | 99.8 /100 | #49 | Exceptional $113,215 |
| Immigrants | Austria | 99.8 /100 | #50 | Exceptional $113,140 |
| Immigrants | South Africa | 99.8 /100 | #51 | Exceptional $112,886 |
| Immigrants | Malaysia | 99.8 /100 | #52 | Exceptional $112,796 |
| Afghans | 99.8 /100 | #53 | Exceptional $112,676 |
| Greeks | 99.8 /100 | #54 | Exceptional $112,630 |
| Lithuanians | 99.8 /100 | #55 | Exceptional $112,484 |
| Egyptians | 99.7 /100 | #56 | Exceptional $112,256 |
| Immigrants | Scotland | 99.7 /100 | #57 | Exceptional $112,175 |
| Soviet Union | 99.7 /100 | #58 | Exceptional $112,008 |