Luxembourger vs Immigrants from Argentina Householder Income Ages 25 - 44 years
COMPARE
Luxembourger
Immigrants from Argentina
Householder Income Ages 25 - 44 years
Householder Income Ages 25 - 44 years Comparison
Luxembourgers
Immigrants from Argentina
$97,237
HOUSEHOLDER INCOME AGES 25 - 44 YEARS
81.5/ 100
METRIC RATING
141st/ 347
METRIC RANK
$101,415
HOUSEHOLDER INCOME AGES 25 - 44 YEARS
97.8/ 100
METRIC RATING
100th/ 347
METRIC RANK
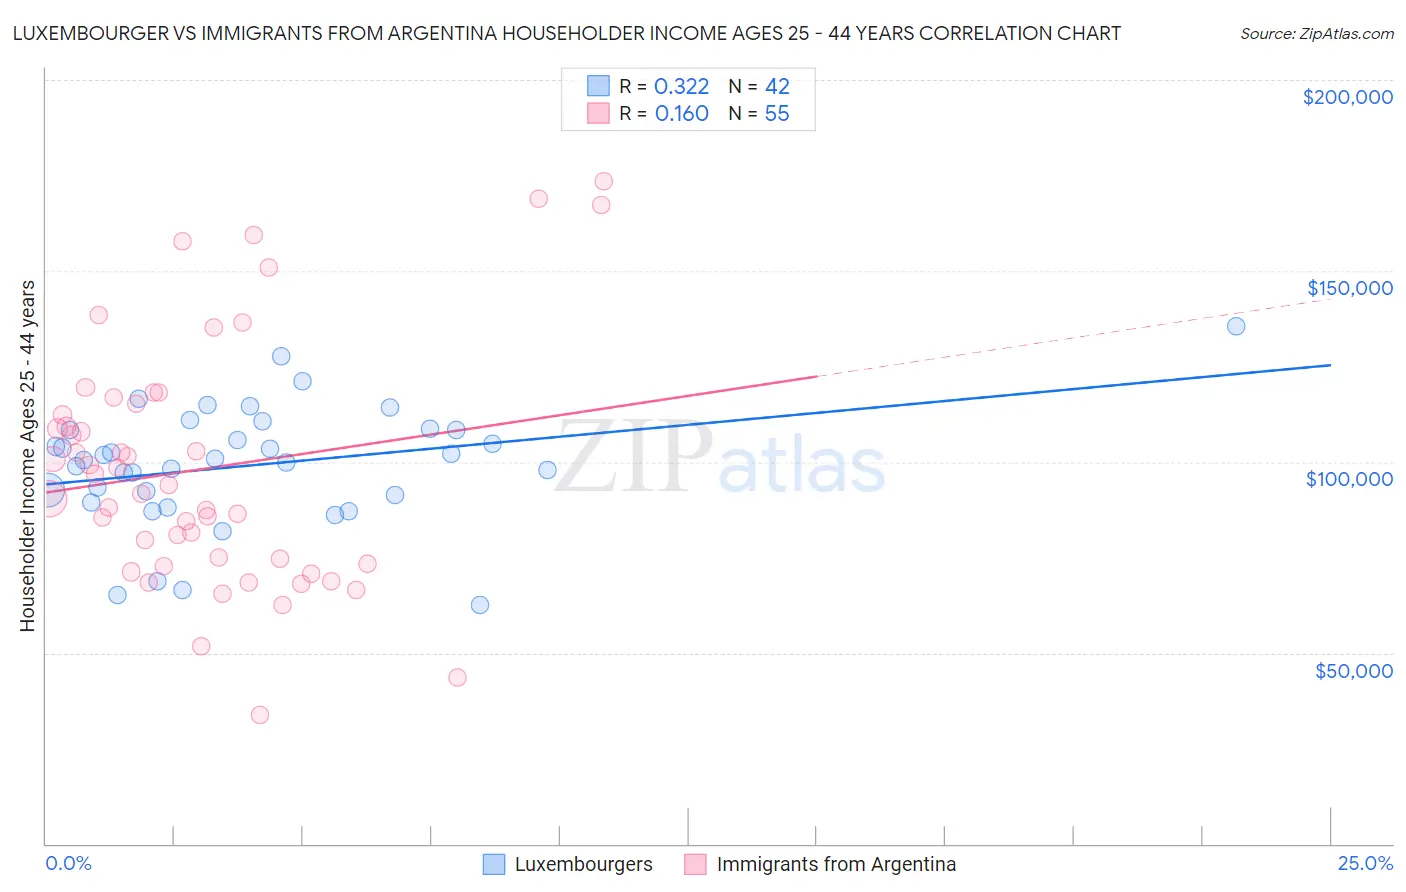
Luxembourger vs Immigrants from Argentina Householder Income Ages 25 - 44 years Correlation Chart
The statistical analysis conducted on geographies consisting of 144,399,527 people shows a mild positive correlation between the proportion of Luxembourgers and household income with householder between the ages 25 and 44 in the United States with a correlation coefficient (R) of 0.322 and weighted average of $97,237. Similarly, the statistical analysis conducted on geographies consisting of 264,114,955 people shows a poor positive correlation between the proportion of Immigrants from Argentina and household income with householder between the ages 25 and 44 in the United States with a correlation coefficient (R) of 0.160 and weighted average of $101,415, a difference of 4.3%.
Householder Income Ages 25 - 44 years Correlation Summary
| Measurement | Luxembourger | Immigrants from Argentina |
| Minimum | $62,500 | $33,750 |
| Maximum | $135,353 | $173,409 |
| Range | $72,853 | $139,659 |
| Mean | $99,089 | $98,084 |
| Median | $100,624 | $93,801 |
| Interquartile 25% (IQ1) | $91,375 | $73,173 |
| Interquartile 75% (IQ3) | $108,286 | $115,092 |
| Interquartile Range (IQR) | $16,911 | $41,919 |
| Standard Deviation (Sample) | $15,610 | $31,751 |
| Standard Deviation (Population) | $15,424 | $31,461 |
Similar Demographics by Householder Income Ages 25 - 44 years
Demographics Similar to Luxembourgers by Householder Income Ages 25 - 44 years
In terms of householder income ages 25 - 44 years, the demographic groups most similar to Luxembourgers are Danish ($97,221, a difference of 0.020%), Immigrants from Jordan ($97,185, a difference of 0.050%), Immigrants from Morocco ($97,305, a difference of 0.070%), Immigrants from Chile ($97,159, a difference of 0.080%), and Immigrants from Peru ($97,329, a difference of 0.090%).
| Demographics | Rating | Rank | Householder Income Ages 25 - 44 years |
| Canadians | 84.5 /100 | #134 | Excellent $97,625 |
| Immigrants | Oceania | 84.5 /100 | #135 | Excellent $97,623 |
| Hungarians | 83.9 /100 | #136 | Excellent $97,544 |
| Lebanese | 82.3 /100 | #137 | Excellent $97,339 |
| Arabs | 82.3 /100 | #138 | Excellent $97,336 |
| Immigrants | Peru | 82.2 /100 | #139 | Excellent $97,329 |
| Immigrants | Morocco | 82.0 /100 | #140 | Excellent $97,305 |
| Luxembourgers | 81.5 /100 | #141 | Excellent $97,237 |
| Danes | 81.3 /100 | #142 | Excellent $97,221 |
| Immigrants | Jordan | 81.0 /100 | #143 | Excellent $97,185 |
| Immigrants | Chile | 80.8 /100 | #144 | Excellent $97,159 |
| Norwegians | 78.2 /100 | #145 | Good $96,866 |
| Ethiopians | 77.8 /100 | #146 | Good $96,824 |
| Immigrants | Syria | 77.4 /100 | #147 | Good $96,789 |
| Irish | 76.9 /100 | #148 | Good $96,730 |
Demographics Similar to Immigrants from Argentina by Householder Income Ages 25 - 44 years
In terms of householder income ages 25 - 44 years, the demographic groups most similar to Immigrants from Argentina are Albanian ($101,367, a difference of 0.050%), Taiwanese ($101,492, a difference of 0.080%), Immigrants from Lebanon ($101,124, a difference of 0.29%), Immigrants from Kazakhstan ($101,727, a difference of 0.31%), and Immigrants from Moldova ($101,091, a difference of 0.32%).
| Demographics | Rating | Rank | Householder Income Ages 25 - 44 years |
| Immigrants | England | 98.4 /100 | #93 | Exceptional $102,020 |
| Sri Lankans | 98.4 /100 | #94 | Exceptional $101,960 |
| Assyrians/Chaldeans/Syriacs | 98.3 /100 | #95 | Exceptional $101,936 |
| Macedonians | 98.3 /100 | #96 | Exceptional $101,882 |
| Austrians | 98.3 /100 | #97 | Exceptional $101,842 |
| Immigrants | Kazakhstan | 98.1 /100 | #98 | Exceptional $101,727 |
| Taiwanese | 97.9 /100 | #99 | Exceptional $101,492 |
| Immigrants | Argentina | 97.8 /100 | #100 | Exceptional $101,415 |
| Albanians | 97.8 /100 | #101 | Exceptional $101,367 |
| Immigrants | Lebanon | 97.4 /100 | #102 | Exceptional $101,124 |
| Immigrants | Moldova | 97.4 /100 | #103 | Exceptional $101,091 |
| Immigrants | Poland | 97.4 /100 | #104 | Exceptional $101,065 |
| Immigrants | Vietnam | 96.5 /100 | #105 | Exceptional $100,535 |
| Immigrants | Brazil | 96.5 /100 | #106 | Exceptional $100,534 |
| Northern Europeans | 96.3 /100 | #107 | Exceptional $100,457 |