Italian vs Immigrants from Argentina Householder Income Ages 25 - 44 years

COMPARE

Italian
Race
Ancestry
AfghanAfricanAlaska NativeAlaskan AthabascanAlbanianAleutAlsatianAmericanApacheArabArapahoArgentineanArmenianAssyrian/Chaldean/SyriacAustralianAustrianBahamianBangladeshiBarbadianBasqueBelgianBelizeanBermudanBhutaneseBlackfeetBolivianBrazilianBritishBritish West IndianBulgarianBurmeseCajunCambodianCanadianCape VerdeanCarpatho RusynCelticCentral AmericanCentral American IndianCherokeeCheyenneChickasawChileanChineseChippewaChoctawColombianColvilleComancheCosta RicanCreeCreekCroatianCrowCubanCypriotCzechCzechoslovakianDanishDelawareDominicanDutchDutch West IndianEastern EuropeanEcuadorianEgyptianEnglishEstonianEthiopianEuropeanFijianFilipinoFinnishFrenchFrench American IndianFrench CanadianGermanGerman RussianGhanaianGreekGuamanian/ChamorroGuatemalanGuyaneseHaitianHmongHonduranHopiHoumaHungarianIcelanderIndian (Asian)IndonesianInupiatIranianIraqiIrishIroquoisIsraeliItalianJamaicanJapaneseJordanianKenyanKiowaKoreanLaotianLatvianLebaneseLiberianLithuanianLumbeeLuxembourgerMacedonianMalaysianMalteseMarshalleseMenomineeMexicanMexican American IndianMongolianMoroccanNative HawaiianNavajoNepaleseNew ZealanderNicaraguanNigerianNorthern EuropeanNorwegianOkinawanOsageOttawaPaiutePakistaniPalestinianPanamanianParaguayanPennsylvania GermanPeruvianPimaPolishPortuguesePotawatomiPuebloPuerto RicanPuget Sound SalishRomanianRussianSalvadoranSamoanScandinavianScotch-IrishScottishSeminoleSenegaleseSerbianShoshoneSierra LeoneanSiouxSlavicSlovakSloveneSomaliSouth AfricanSouth AmericanSouth American IndianSoviet UnionSpaniardSpanishSpanish AmericanSpanish American IndianSri LankanSubsaharan AfricanSudaneseSwedishSwissSyrianTaiwaneseThaiTlingit-HaidaTohono O'OdhamTonganTrinidadian and TobagonianTsimshianTurkishU.S. Virgin IslanderUgandanUkrainianUruguayanUteVenezuelanVietnameseWelshWest IndianYakamaYaquiYugoslavianYumanYup'ikZimbabwean
Immigration
NonimmigrantsImmigrantsAfghanistanAfricaAlbaniaArmeniaAsiaAustraliaAustriaBahamasBangladeshBarbadosBelarusBelgiumBelizeBoliviaBosnia and HerzegovinaBrazilBulgariaBurma/MyanmarCabo VerdeCambodiaCameroonCanadaCaribbeanCentral AmericaChileChinaColombiaCongoCosta RicaCroatiaCubaCzechoslovakiaDenmarkDominicaDominican RepublicEastern AfricaEastern AsiaEastern EuropeEcuadorEgyptEl SalvadorEnglandEritreaEthiopiaEuropeFijiFranceGermanyGhanaGreeceGrenadaGuatemalaGuyanaHaitiHondurasHong KongHungaryIndiaIndonesiaIranIraqIrelandIsraelItalyJamaicaJapanJordanKazakhstanKenyaKoreaKuwaitLaosLatin AmericaLatviaLebanonLiberiaLithuaniaMalaysiaMexicoMicronesiaMiddle AfricaMoldovaMoroccoNepalNetherlandsNicaraguaNigeriaNorth AmericaNorth MacedoniaNorthern AfricaNorthern EuropeNorwayOceaniaPakistanPanamaPeruPhilippinesPolandPortugalRomaniaRussiaSaudi ArabiaScotlandSenegalSerbiaSierra LeoneSingaporeSomaliaSouth AfricaSouth AmericaSouth Central AsiaSouth Eastern AsiaSouthern EuropeSpainSri LankaSt. Vincent and the GrenadinesSudanSwedenSwitzerlandSyriaTaiwanThailandTrinidad and TobagoTurkeyUgandaUkraineUruguayUzbekistanVenezuelaVietnamWest IndiesWestern AfricaWestern AsiaWestern EuropeYemenZaireZimbabweAzores
Immigrants from Argentina
Race
Ancestry
AfghanAfricanAlaska NativeAlaskan AthabascanAlbanianAleutAlsatianAmericanApacheArabArapahoArgentineanArmenianAssyrian/Chaldean/SyriacAustralianAustrianBahamianBangladeshiBarbadianBasqueBelgianBelizeanBermudanBhutaneseBlackfeetBolivianBrazilianBritishBritish West IndianBulgarianBurmeseCajunCambodianCanadianCape VerdeanCarpatho RusynCelticCentral AmericanCentral American IndianCherokeeCheyenneChickasawChileanChineseChippewaChoctawColombianColvilleComancheCosta RicanCreeCreekCroatianCrowCubanCypriotCzechCzechoslovakianDanishDelawareDominicanDutchDutch West IndianEastern EuropeanEcuadorianEgyptianEnglishEstonianEthiopianEuropeanFijianFilipinoFinnishFrenchFrench American IndianFrench CanadianGermanGerman RussianGhanaianGreekGuamanian/ChamorroGuatemalanGuyaneseHaitianHmongHonduranHopiHoumaHungarianIcelanderIndian (Asian)IndonesianInupiatIranianIraqiIrishIroquoisIsraeliJamaicanJapaneseJordanianKenyanKiowaKoreanLaotianLatvianLebaneseLiberianLithuanianLumbeeLuxembourgerMacedonianMalaysianMalteseMarshalleseMenomineeMexicanMexican American IndianMongolianMoroccanNative HawaiianNavajoNepaleseNew ZealanderNicaraguanNigerianNorthern EuropeanNorwegianOkinawanOsageOttawaPaiutePakistaniPalestinianPanamanianParaguayanPennsylvania GermanPeruvianPimaPolishPortuguesePotawatomiPuebloPuerto RicanPuget Sound SalishRomanianRussianSalvadoranSamoanScandinavianScotch-IrishScottishSeminoleSenegaleseSerbianShoshoneSierra LeoneanSiouxSlavicSlovakSloveneSomaliSouth AfricanSouth AmericanSouth American IndianSoviet UnionSpaniardSpanishSpanish AmericanSpanish American IndianSri LankanSubsaharan AfricanSudaneseSwedishSwissSyrianTaiwaneseThaiTlingit-HaidaTohono O'OdhamTonganTrinidadian and TobagonianTsimshianTurkishU.S. Virgin IslanderUgandanUkrainianUruguayanUteVenezuelanVietnameseWelshWest IndianYakamaYaquiYugoslavianYumanYup'ikZimbabwean
Immigration
NonimmigrantsImmigrantsAfghanistanAfricaAlbaniaArgentinaArmeniaAsiaAustraliaAustriaBahamasBangladeshBarbadosBelarusBelgiumBelizeBoliviaBosnia and HerzegovinaBrazilBulgariaBurma/MyanmarCabo VerdeCambodiaCameroonCanadaCaribbeanCentral AmericaChileChinaColombiaCongoCosta RicaCroatiaCubaCzechoslovakiaDenmarkDominicaDominican RepublicEastern AfricaEastern AsiaEastern EuropeEcuadorEgyptEl SalvadorEnglandEritreaEthiopiaEuropeFijiFranceGermanyGhanaGreeceGrenadaGuatemalaGuyanaHaitiHondurasHong KongHungaryIndiaIndonesiaIranIraqIrelandIsraelItalyJamaicaJapanJordanKazakhstanKenyaKoreaKuwaitLaosLatin AmericaLatviaLebanonLiberiaLithuaniaMalaysiaMexicoMicronesiaMiddle AfricaMoldovaMoroccoNepalNetherlandsNicaraguaNigeriaNorth AmericaNorth MacedoniaNorthern AfricaNorthern EuropeNorwayOceaniaPakistanPanamaPeruPhilippinesPolandPortugalRomaniaRussiaSaudi ArabiaScotlandSenegalSerbiaSierra LeoneSingaporeSomaliaSouth AfricaSouth AmericaSouth Central AsiaSouth Eastern AsiaSouthern EuropeSpainSri LankaSt. Vincent and the GrenadinesSudanSwedenSwitzerlandSyriaTaiwanThailandTrinidad and TobagoTurkeyUgandaUkraineUruguayUzbekistanVenezuelaVietnamWest IndiesWestern AfricaWestern AsiaWestern EuropeYemenZaireZimbabweAzores
Householder Income Ages 25 - 44 years
Income
Poverty
Unemployment
Labor Participation
Family Structure
Vehicle Availability
Education Level
Disability

Householder Income Ages 25 - 44 years Comparison

Italians

Immigrants from Argentina

Exceptional
Exceptional
$104,215
HOUSEHOLDER INCOME AGES 25 - 44 YEARS
99.5/ 100
METRIC RATING
73rd/ 347
METRIC RANK
$101,415
HOUSEHOLDER INCOME AGES 25 - 44 YEARS
97.8/ 100
METRIC RATING
100th/ 347
METRIC RANK

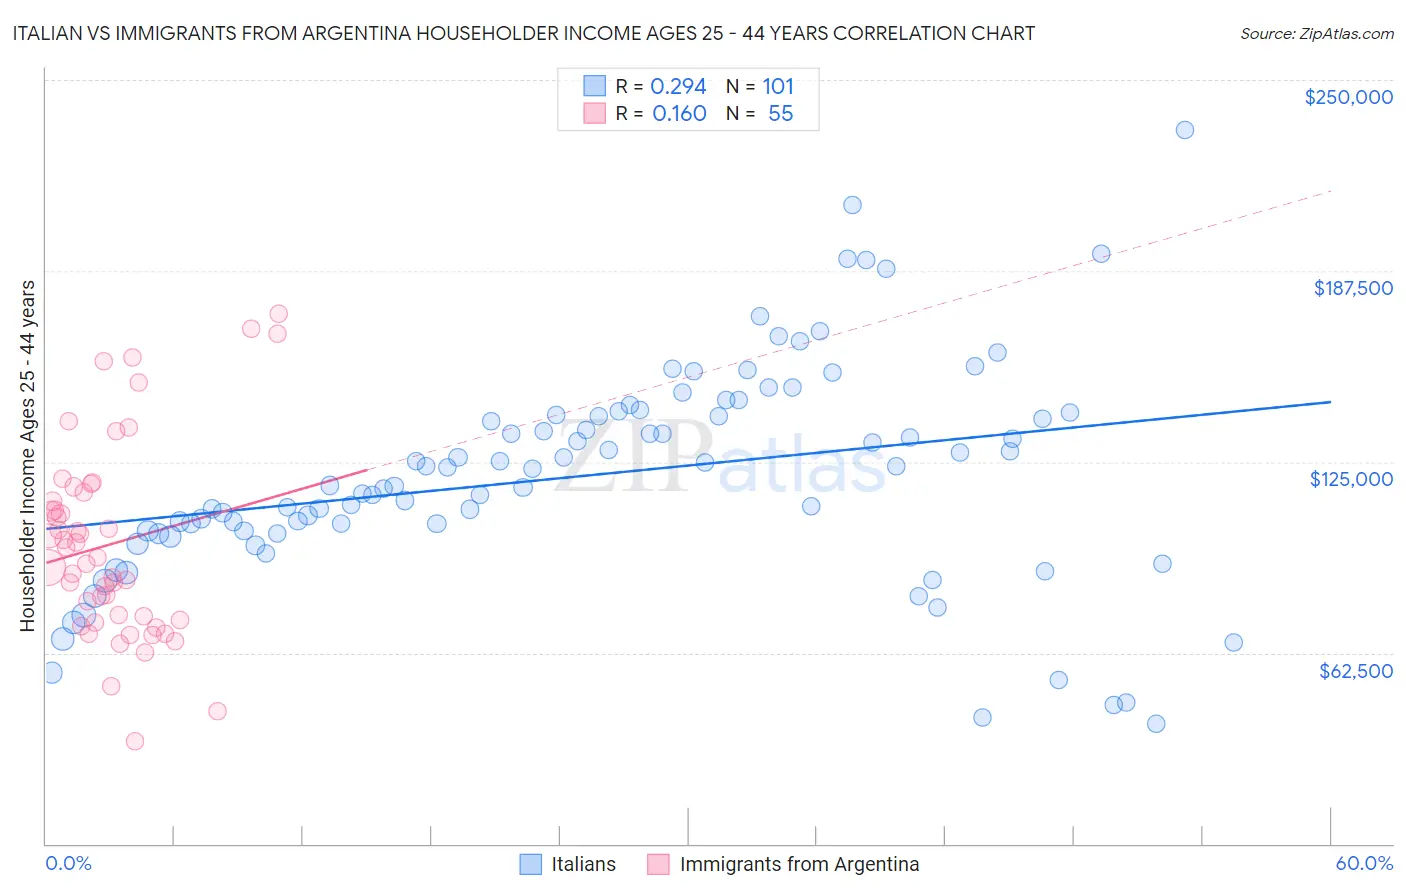
Italian vs Immigrants from Argentina Householder Income Ages 25 - 44 years Correlation Chart

The statistical analysis conducted on geographies consisting of 568,883,722 people shows a weak positive correlation between the proportion of Italians and household income with householder between the ages 25 and 44 in the United States with a correlation coefficient (R) of 0.294 and weighted average of $104,215. Similarly, the statistical analysis conducted on geographies consisting of 264,114,955 people shows a poor positive correlation between the proportion of Immigrants from Argentina and household income with householder between the ages 25 and 44 in the United States with a correlation coefficient (R) of 0.160 and weighted average of $101,415, a difference of 2.8%.
Italian vs Immigrants from Argentina Householder Income Ages 25 - 44 years

Householder Income Ages 25 - 44 years Correlation Summary

MeasurementItalianImmigrants from Argentina
Minimum$39,167$33,750
Maximum$233,533$173,409
Range$194,366$139,659
Mean$120,730$98,084
Median$122,854$93,801
Interquartile 25% (IQ1)$102,018$73,173
Interquartile 75% (IQ3)$140,706$115,092
Interquartile Range (IQR)$38,688$41,919
Standard Deviation (Sample)$35,574$31,751
Standard Deviation (Population)$35,397$31,461

Similar Demographics by Householder Income Ages 25 - 44 years

Demographics Similar to Italians by Householder Income Ages 25 - 44 years

In terms of householder income ages 25 - 44 years, the demographic groups most similar to Italians are Chinese ($104,264, a difference of 0.050%), Afghan ($104,410, a difference of 0.19%), Immigrants from Fiji ($103,954, a difference of 0.25%), Immigrants from Croatia ($104,503, a difference of 0.28%), and Mongolian ($104,578, a difference of 0.35%).
DemographicsRating | RankHouseholder Income Ages 25 - 44 years
Laotians
99.7
/100
|
#66
Exceptional
$104,993
Immigrants | Romania
99.6
/100
|
#67
Exceptional
$104,713
Immigrants | Eastern Europe
99.6
/100
|
#68
Exceptional
$104,662
Mongolians
99.6
/100
|
#69
Exceptional
$104,578
Immigrants | Croatia
99.6
/100
|
#70
Exceptional
$104,503
Afghans
99.6
/100
|
#71
Exceptional
$104,410
Chinese
99.5
/100
|
#72
Exceptional
$104,264
Italians
99.5
/100
|
#73
Exceptional
$104,215
Immigrants | Fiji
99.5
/100
|
#74
Exceptional
$103,954
Koreans
99.4
/100
|
#75
Exceptional
$103,824
Immigrants | Spain
99.4
/100
|
#76
Exceptional
$103,752
Immigrants | Southern Europe
99.3
/100
|
#77
Exceptional
$103,486
Immigrants | Bulgaria
99.3
/100
|
#78
Exceptional
$103,423
Armenians
99.2
/100
|
#79
Exceptional
$103,248
Immigrants | Egypt
99.2
/100
|
#80
Exceptional
$103,192

Demographics Similar to Immigrants from Argentina by Householder Income Ages 25 - 44 years

In terms of householder income ages 25 - 44 years, the demographic groups most similar to Immigrants from Argentina are Albanian ($101,367, a difference of 0.050%), Taiwanese ($101,492, a difference of 0.080%), Immigrants from Lebanon ($101,124, a difference of 0.29%), Immigrants from Kazakhstan ($101,727, a difference of 0.31%), and Immigrants from Moldova ($101,091, a difference of 0.32%).
DemographicsRating | RankHouseholder Income Ages 25 - 44 years
Immigrants | England
98.4
/100
|
#93
Exceptional
$102,020
Sri Lankans
98.4
/100
|
#94
Exceptional
$101,960
Assyrians/Chaldeans/Syriacs
98.3
/100
|
#95
Exceptional
$101,936
Macedonians
98.3
/100
|
#96
Exceptional
$101,882
Austrians
98.3
/100
|
#97
Exceptional
$101,842
Immigrants | Kazakhstan
98.1
/100
|
#98
Exceptional
$101,727
Taiwanese
97.9
/100
|
#99
Exceptional
$101,492
Immigrants | Argentina
97.8
/100
|
#100
Exceptional
$101,415
Albanians
97.8
/100
|
#101
Exceptional
$101,367
Immigrants | Lebanon
97.4
/100
|
#102
Exceptional
$101,124
Immigrants | Moldova
97.4
/100
|
#103
Exceptional
$101,091
Immigrants | Poland
97.4
/100
|
#104
Exceptional
$101,065
Immigrants | Vietnam
96.5
/100
|
#105
Exceptional
$100,535
Immigrants | Brazil
96.5
/100
|
#106
Exceptional
$100,534
Northern Europeans
96.3
/100
|
#107
Exceptional
$100,457