Immigrants from Turkey vs Barbadian Median Male Earnings
COMPARE
Immigrants from Turkey
Barbadian
Median Male Earnings
Median Male Earnings Comparison
Immigrants from Turkey
Barbadians
$62,728
MEDIAN MALE EARNINGS
100.0/ 100
METRIC RATING
41st/ 347
METRIC RANK
$51,236
MEDIAN MALE EARNINGS
3.9/ 100
METRIC RATING
231st/ 347
METRIC RANK
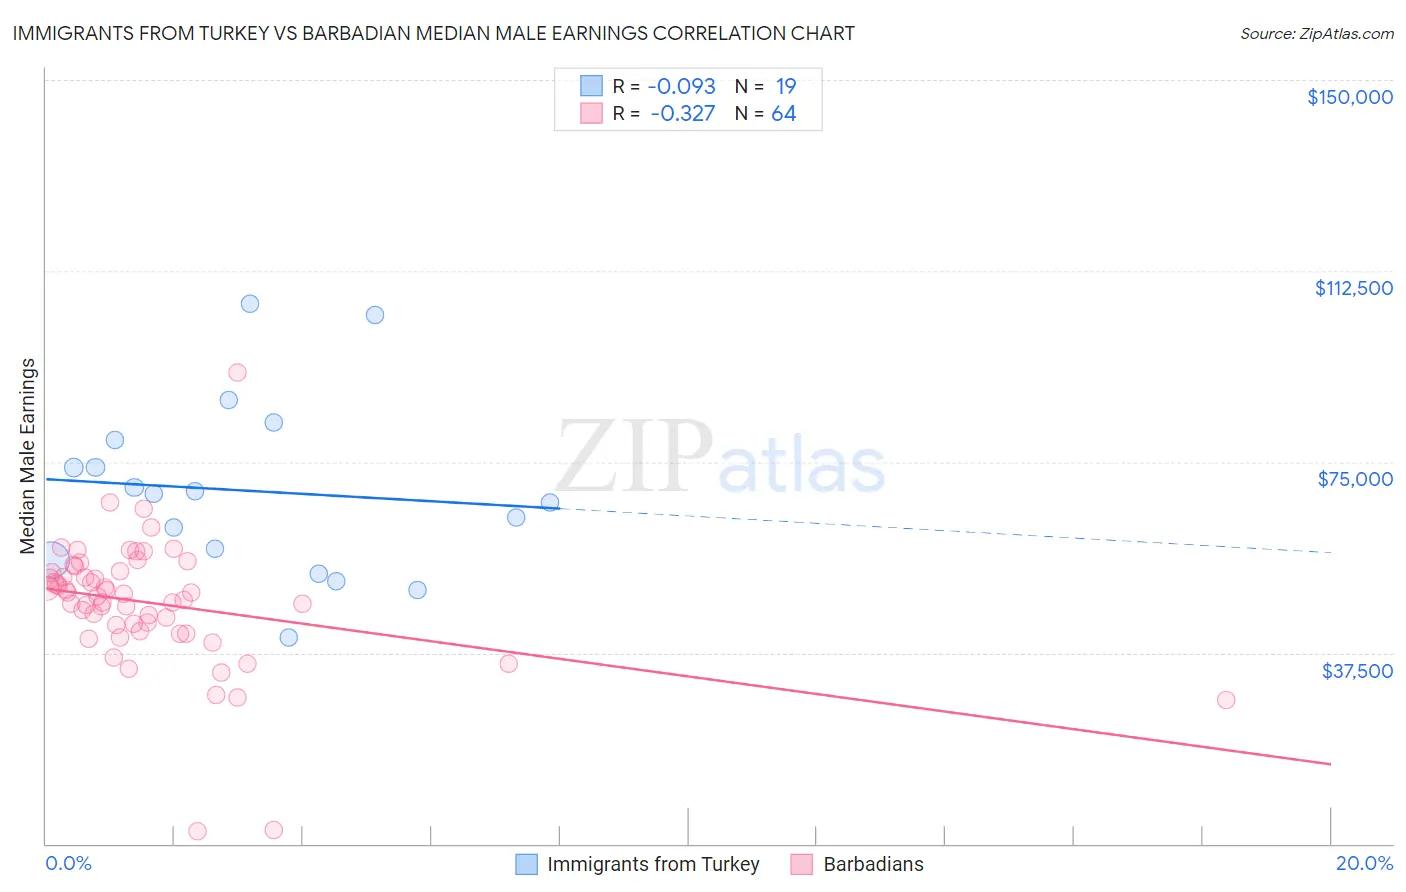
Immigrants from Turkey vs Barbadian Median Male Earnings Correlation Chart
The statistical analysis conducted on geographies consisting of 223,034,216 people shows a slight negative correlation between the proportion of Immigrants from Turkey and median male earnings in the United States with a correlation coefficient (R) of -0.093 and weighted average of $62,728. Similarly, the statistical analysis conducted on geographies consisting of 141,271,676 people shows a mild negative correlation between the proportion of Barbadians and median male earnings in the United States with a correlation coefficient (R) of -0.327 and weighted average of $51,236, a difference of 22.4%.
Median Male Earnings Correlation Summary
| Measurement | Immigrants from Turkey | Barbadian |
| Minimum | $40,469 | $2,499 |
| Maximum | $106,104 | $92,582 |
| Range | $65,635 | $90,083 |
| Mean | $69,295 | $47,251 |
| Median | $68,821 | $48,821 |
| Interquartile 25% (IQ1) | $55,843 | $42,256 |
| Interquartile 75% (IQ3) | $79,397 | $53,422 |
| Interquartile Range (IQR) | $23,554 | $11,166 |
| Standard Deviation (Sample) | $17,281 | $12,825 |
| Standard Deviation (Population) | $16,820 | $12,724 |
Similar Demographics by Median Male Earnings
Demographics Similar to Immigrants from Turkey by Median Male Earnings
In terms of median male earnings, the demographic groups most similar to Immigrants from Turkey are Immigrants from Greece ($62,689, a difference of 0.060%), Immigrants from Belarus ($62,658, a difference of 0.11%), Australian ($62,857, a difference of 0.21%), Immigrants from South Africa ($62,899, a difference of 0.27%), and Cambodian ($62,516, a difference of 0.34%).
| Demographics | Rating | Rank | Median Male Earnings |
| Immigrants | Russia | 100.0 /100 | #34 | Exceptional $63,326 |
| Immigrants | Asia | 100.0 /100 | #35 | Exceptional $63,240 |
| Israelis | 100.0 /100 | #36 | Exceptional $63,228 |
| Immigrants | Sri Lanka | 100.0 /100 | #37 | Exceptional $63,099 |
| Maltese | 100.0 /100 | #38 | Exceptional $62,953 |
| Immigrants | South Africa | 100.0 /100 | #39 | Exceptional $62,899 |
| Australians | 100.0 /100 | #40 | Exceptional $62,857 |
| Immigrants | Turkey | 100.0 /100 | #41 | Exceptional $62,728 |
| Immigrants | Greece | 100.0 /100 | #42 | Exceptional $62,689 |
| Immigrants | Belarus | 100.0 /100 | #43 | Exceptional $62,658 |
| Cambodians | 100.0 /100 | #44 | Exceptional $62,516 |
| Bulgarians | 100.0 /100 | #45 | Exceptional $62,378 |
| Immigrants | Czechoslovakia | 99.9 /100 | #46 | Exceptional $62,217 |
| Immigrants | Austria | 99.9 /100 | #47 | Exceptional $62,164 |
| Immigrants | Malaysia | 99.9 /100 | #48 | Exceptional $62,121 |
Demographics Similar to Barbadians by Median Male Earnings
In terms of median male earnings, the demographic groups most similar to Barbadians are Sudanese ($51,216, a difference of 0.040%), Aleut ($51,168, a difference of 0.13%), Immigrants from Nigeria ($51,310, a difference of 0.14%), Cape Verdean ($51,103, a difference of 0.26%), and Immigrants from Trinidad and Tobago ($51,376, a difference of 0.27%).
| Demographics | Rating | Rank | Median Male Earnings |
| Immigrants | Cambodia | 5.5 /100 | #224 | Tragic $51,594 |
| Immigrants | Sudan | 5.0 /100 | #225 | Tragic $51,489 |
| Japanese | 4.9 /100 | #226 | Tragic $51,473 |
| Trinidadians and Tobagonians | 4.8 /100 | #227 | Tragic $51,446 |
| Samoans | 4.6 /100 | #228 | Tragic $51,389 |
| Immigrants | Trinidad and Tobago | 4.5 /100 | #229 | Tragic $51,376 |
| Immigrants | Nigeria | 4.2 /100 | #230 | Tragic $51,310 |
| Barbadians | 3.9 /100 | #231 | Tragic $51,236 |
| Sudanese | 3.9 /100 | #232 | Tragic $51,216 |
| Aleuts | 3.7 /100 | #233 | Tragic $51,168 |
| Cape Verdeans | 3.5 /100 | #234 | Tragic $51,103 |
| Immigrants | Western Africa | 3.0 /100 | #235 | Tragic $50,940 |
| Pennsylvania Germans | 2.8 /100 | #236 | Tragic $50,878 |
| Immigrants | Barbados | 2.6 /100 | #237 | Tragic $50,795 |
| Malaysians | 2.5 /100 | #238 | Tragic $50,772 |