Immigrants from Turkey vs Mexican American Indian Median Male Earnings
COMPARE
Immigrants from Turkey
Mexican American Indian
Median Male Earnings
Median Male Earnings Comparison
Immigrants from Turkey
Mexican American Indians
$62,728
MEDIAN MALE EARNINGS
100.0/ 100
METRIC RATING
41st/ 347
METRIC RANK
$47,990
MEDIAN MALE EARNINGS
0.2/ 100
METRIC RATING
286th/ 347
METRIC RANK
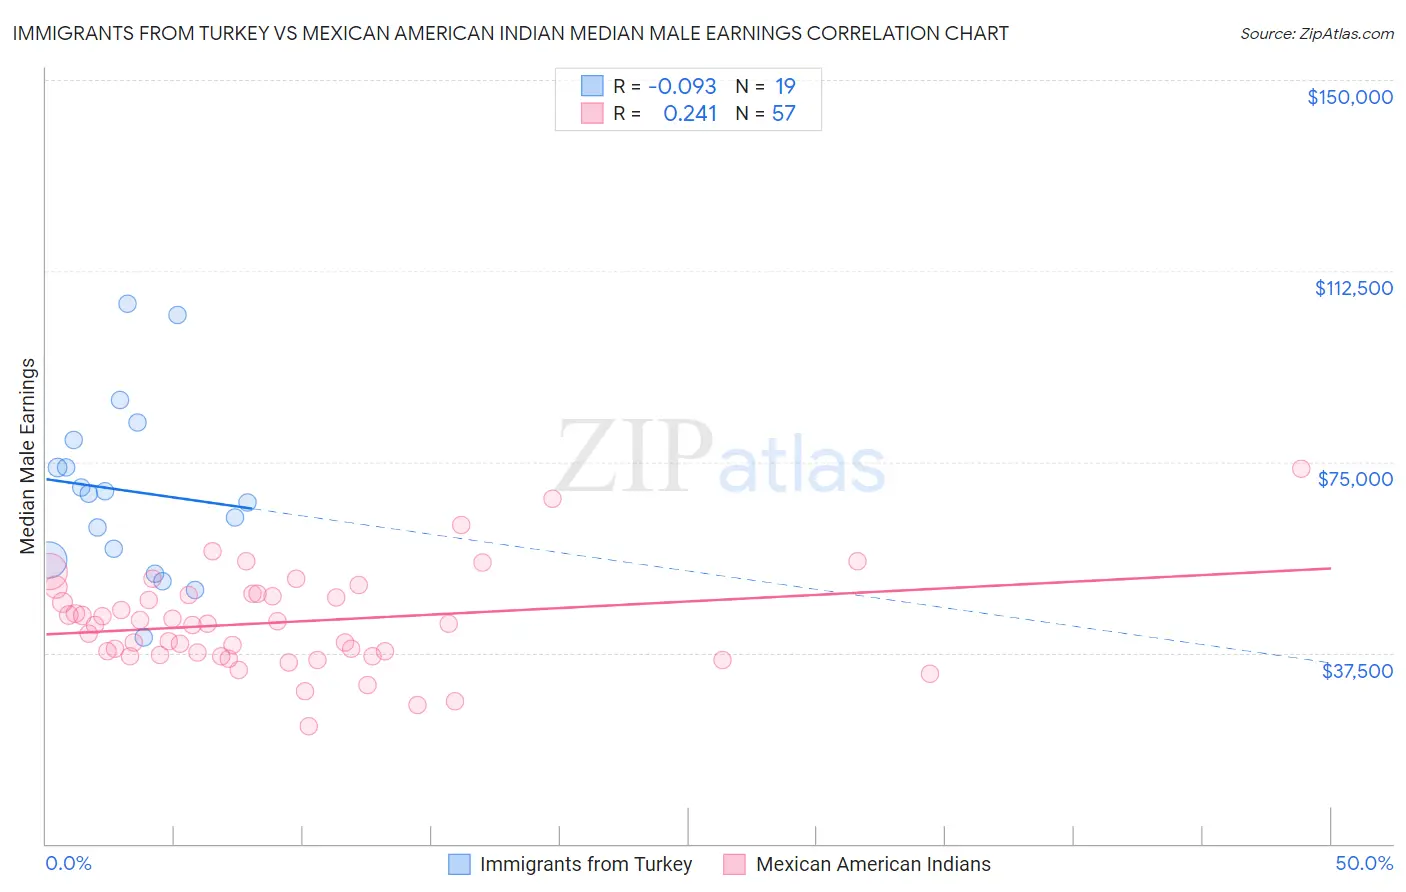
Immigrants from Turkey vs Mexican American Indian Median Male Earnings Correlation Chart
The statistical analysis conducted on geographies consisting of 223,034,216 people shows a slight negative correlation between the proportion of Immigrants from Turkey and median male earnings in the United States with a correlation coefficient (R) of -0.093 and weighted average of $62,728. Similarly, the statistical analysis conducted on geographies consisting of 317,531,084 people shows a weak positive correlation between the proportion of Mexican American Indians and median male earnings in the United States with a correlation coefficient (R) of 0.241 and weighted average of $47,990, a difference of 30.7%.
Median Male Earnings Correlation Summary
| Measurement | Immigrants from Turkey | Mexican American Indian |
| Minimum | $40,469 | $23,167 |
| Maximum | $106,104 | $73,750 |
| Range | $65,635 | $50,583 |
| Mean | $69,295 | $43,547 |
| Median | $68,821 | $43,107 |
| Interquartile 25% (IQ1) | $55,843 | $36,938 |
| Interquartile 75% (IQ3) | $79,397 | $48,895 |
| Interquartile Range (IQR) | $23,554 | $11,957 |
| Standard Deviation (Sample) | $17,281 | $9,541 |
| Standard Deviation (Population) | $16,820 | $9,457 |
Similar Demographics by Median Male Earnings
Demographics Similar to Immigrants from Turkey by Median Male Earnings
In terms of median male earnings, the demographic groups most similar to Immigrants from Turkey are Immigrants from Greece ($62,689, a difference of 0.060%), Immigrants from Belarus ($62,658, a difference of 0.11%), Australian ($62,857, a difference of 0.21%), Immigrants from South Africa ($62,899, a difference of 0.27%), and Cambodian ($62,516, a difference of 0.34%).
| Demographics | Rating | Rank | Median Male Earnings |
| Immigrants | Russia | 100.0 /100 | #34 | Exceptional $63,326 |
| Immigrants | Asia | 100.0 /100 | #35 | Exceptional $63,240 |
| Israelis | 100.0 /100 | #36 | Exceptional $63,228 |
| Immigrants | Sri Lanka | 100.0 /100 | #37 | Exceptional $63,099 |
| Maltese | 100.0 /100 | #38 | Exceptional $62,953 |
| Immigrants | South Africa | 100.0 /100 | #39 | Exceptional $62,899 |
| Australians | 100.0 /100 | #40 | Exceptional $62,857 |
| Immigrants | Turkey | 100.0 /100 | #41 | Exceptional $62,728 |
| Immigrants | Greece | 100.0 /100 | #42 | Exceptional $62,689 |
| Immigrants | Belarus | 100.0 /100 | #43 | Exceptional $62,658 |
| Cambodians | 100.0 /100 | #44 | Exceptional $62,516 |
| Bulgarians | 100.0 /100 | #45 | Exceptional $62,378 |
| Immigrants | Czechoslovakia | 99.9 /100 | #46 | Exceptional $62,217 |
| Immigrants | Austria | 99.9 /100 | #47 | Exceptional $62,164 |
| Immigrants | Malaysia | 99.9 /100 | #48 | Exceptional $62,121 |
Demographics Similar to Mexican American Indians by Median Male Earnings
In terms of median male earnings, the demographic groups most similar to Mexican American Indians are Paiute ($47,991, a difference of 0.0%), African ($47,994, a difference of 0.010%), Immigrants from El Salvador ($47,973, a difference of 0.040%), Immigrants from Jamaica ($48,040, a difference of 0.10%), and Shoshone ($47,930, a difference of 0.12%).
| Demographics | Rating | Rank | Median Male Earnings |
| Hmong | 0.2 /100 | #279 | Tragic $48,254 |
| Comanche | 0.2 /100 | #280 | Tragic $48,202 |
| Marshallese | 0.2 /100 | #281 | Tragic $48,137 |
| Central Americans | 0.2 /100 | #282 | Tragic $48,093 |
| Immigrants | Jamaica | 0.2 /100 | #283 | Tragic $48,040 |
| Africans | 0.2 /100 | #284 | Tragic $47,994 |
| Paiute | 0.2 /100 | #285 | Tragic $47,991 |
| Mexican American Indians | 0.2 /100 | #286 | Tragic $47,990 |
| Immigrants | El Salvador | 0.2 /100 | #287 | Tragic $47,973 |
| Shoshone | 0.2 /100 | #288 | Tragic $47,930 |
| Chickasaw | 0.1 /100 | #289 | Tragic $47,832 |
| Immigrants | Belize | 0.1 /100 | #290 | Tragic $47,809 |
| Choctaw | 0.1 /100 | #291 | Tragic $47,729 |
| Immigrants | Dominica | 0.1 /100 | #292 | Tragic $47,651 |
| Indonesians | 0.1 /100 | #293 | Tragic $47,503 |