Immigrants from Trinidad and Tobago vs Vietnamese Householder Income Ages 45 - 64 years
COMPARE
Immigrants from Trinidad and Tobago
Vietnamese
Householder Income Ages 45 - 64 years
Householder Income Ages 45 - 64 years Comparison
Immigrants from Trinidad and Tobago
Vietnamese
$91,347
HOUSEHOLDER INCOME AGES 45 - 64 YEARS
1.1/ 100
METRIC RATING
243rd/ 347
METRIC RANK
$93,788
HOUSEHOLDER INCOME AGES 45 - 64 YEARS
3.6/ 100
METRIC RATING
229th/ 347
METRIC RANK
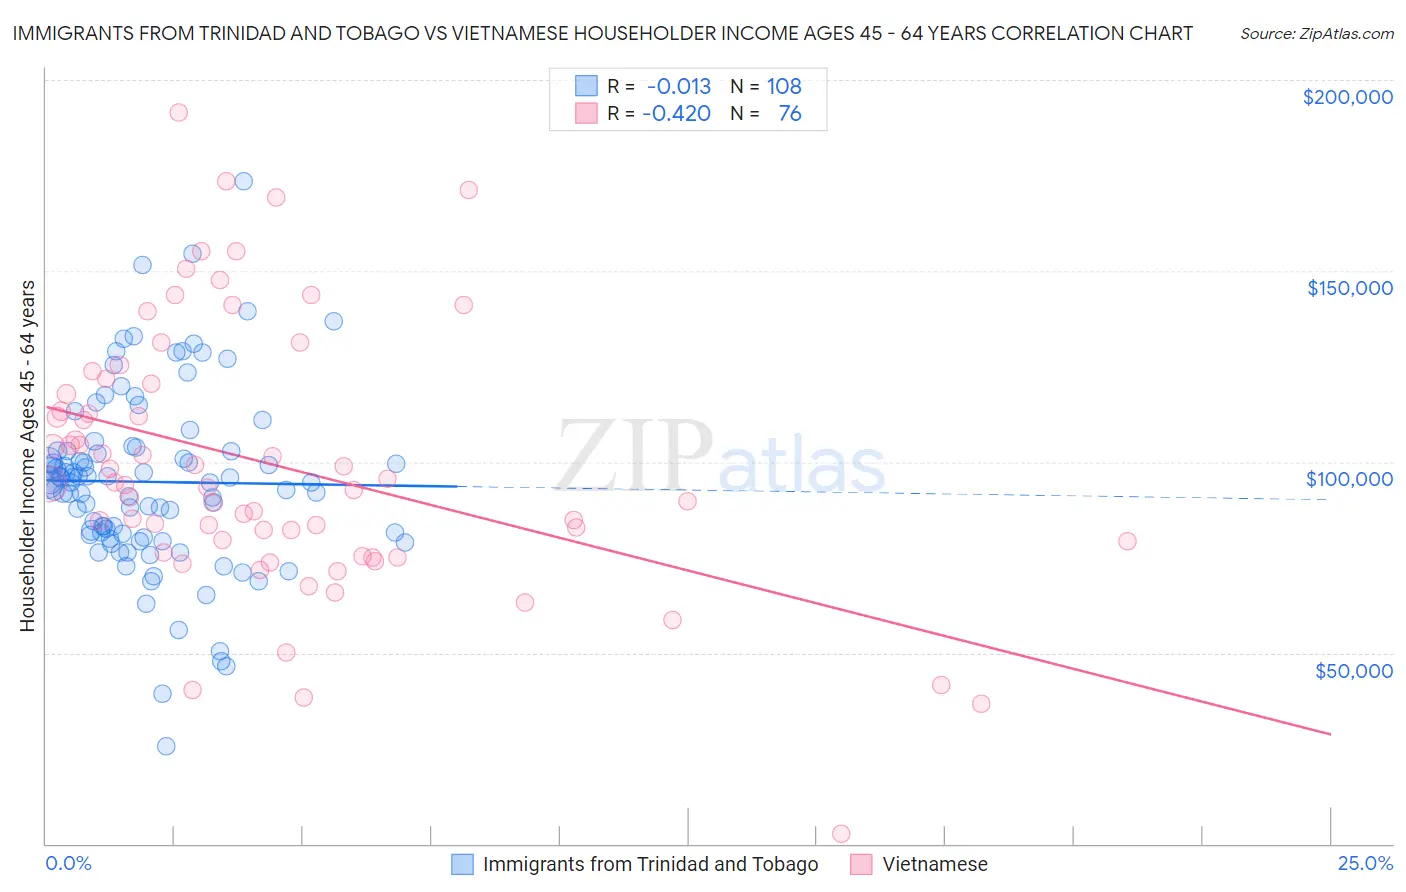
Immigrants from Trinidad and Tobago vs Vietnamese Householder Income Ages 45 - 64 years Correlation Chart
The statistical analysis conducted on geographies consisting of 223,374,327 people shows no correlation between the proportion of Immigrants from Trinidad and Tobago and household income with householder between the ages 45 and 64 in the United States with a correlation coefficient (R) of -0.013 and weighted average of $91,347. Similarly, the statistical analysis conducted on geographies consisting of 170,554,464 people shows a moderate negative correlation between the proportion of Vietnamese and household income with householder between the ages 45 and 64 in the United States with a correlation coefficient (R) of -0.420 and weighted average of $93,788, a difference of 2.7%.
Householder Income Ages 45 - 64 years Correlation Summary
| Measurement | Immigrants from Trinidad and Tobago | Vietnamese |
| Minimum | $25,417 | $2,499 |
| Maximum | $173,438 | $191,429 |
| Range | $148,021 | $188,930 |
| Mean | $94,766 | $99,011 |
| Median | $94,630 | $94,156 |
| Interquartile 25% (IQ1) | $80,933 | $77,796 |
| Interquartile 75% (IQ3) | $102,864 | $119,213 |
| Interquartile Range (IQR) | $21,931 | $41,417 |
| Standard Deviation (Sample) | $23,554 | $34,793 |
| Standard Deviation (Population) | $23,445 | $34,563 |
Demographics Similar to Immigrants from Trinidad and Tobago and Vietnamese by Householder Income Ages 45 - 64 years
In terms of householder income ages 45 - 64 years, the demographic groups most similar to Immigrants from Trinidad and Tobago are Trinidadian and Tobagonian ($91,357, a difference of 0.010%), Inupiat ($91,355, a difference of 0.010%), Immigrants from Burma/Myanmar ($91,385, a difference of 0.040%), Immigrants from Middle Africa ($91,293, a difference of 0.060%), and Immigrants from Ecuador ($91,462, a difference of 0.13%). Similarly, the demographic groups most similar to Vietnamese are Immigrants from Sudan ($93,781, a difference of 0.010%), Immigrants from Panama ($93,815, a difference of 0.030%), Ecuadorian ($93,739, a difference of 0.050%), Sudanese ($93,718, a difference of 0.070%), and Alaska Native ($93,991, a difference of 0.22%).
| Demographics | Rating | Rank | Householder Income Ages 45 - 64 years |
| Immigrants | Azores | 4.3 /100 | #226 | Tragic $94,138 |
| Alaska Natives | 4.0 /100 | #227 | Tragic $93,991 |
| Immigrants | Panama | 3.7 /100 | #228 | Tragic $93,815 |
| Vietnamese | 3.6 /100 | #229 | Tragic $93,788 |
| Immigrants | Sudan | 3.6 /100 | #230 | Tragic $93,781 |
| Ecuadorians | 3.6 /100 | #231 | Tragic $93,739 |
| Sudanese | 3.5 /100 | #232 | Tragic $93,718 |
| Nepalese | 3.0 /100 | #233 | Tragic $93,355 |
| Immigrants | El Salvador | 2.7 /100 | #234 | Tragic $93,176 |
| Nicaraguans | 2.0 /100 | #235 | Tragic $92,554 |
| Immigrants | Western Africa | 1.8 /100 | #236 | Tragic $92,384 |
| Immigrants | Bangladesh | 1.7 /100 | #237 | Tragic $92,208 |
| Pennsylvania Germans | 1.5 /100 | #238 | Tragic $91,956 |
| Immigrants | Ecuador | 1.2 /100 | #239 | Tragic $91,462 |
| Immigrants | Burma/Myanmar | 1.1 /100 | #240 | Tragic $91,385 |
| Trinidadians and Tobagonians | 1.1 /100 | #241 | Tragic $91,357 |
| Inupiat | 1.1 /100 | #242 | Tragic $91,355 |
| Immigrants | Trinidad and Tobago | 1.1 /100 | #243 | Tragic $91,347 |
| Immigrants | Middle Africa | 1.1 /100 | #244 | Tragic $91,293 |
| Guyanese | 0.9 /100 | #245 | Tragic $90,966 |
| Central Americans | 0.9 /100 | #246 | Tragic $90,951 |