Barbadian vs Vietnamese Householder Income Ages 45 - 64 years
COMPARE
Barbadian
Vietnamese
Householder Income Ages 45 - 64 years
Householder Income Ages 45 - 64 years Comparison
Barbadians
Vietnamese
$90,266
HOUSEHOLDER INCOME AGES 45 - 64 YEARS
0.6/ 100
METRIC RATING
253rd/ 347
METRIC RANK
$93,788
HOUSEHOLDER INCOME AGES 45 - 64 YEARS
3.6/ 100
METRIC RATING
229th/ 347
METRIC RANK
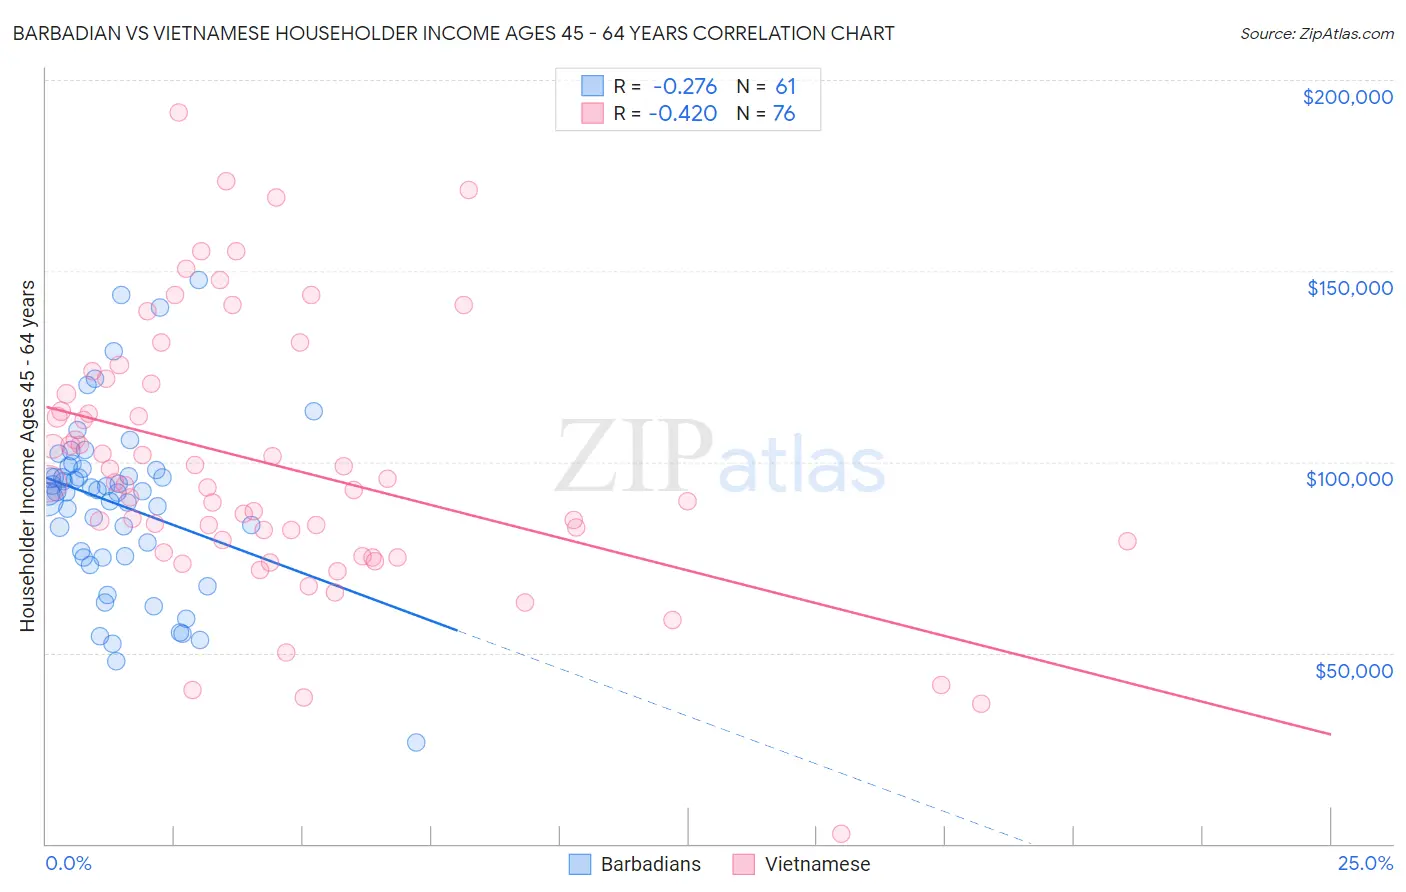
Barbadian vs Vietnamese Householder Income Ages 45 - 64 years Correlation Chart
The statistical analysis conducted on geographies consisting of 141,200,649 people shows a weak negative correlation between the proportion of Barbadians and household income with householder between the ages 45 and 64 in the United States with a correlation coefficient (R) of -0.276 and weighted average of $90,266. Similarly, the statistical analysis conducted on geographies consisting of 170,554,464 people shows a moderate negative correlation between the proportion of Vietnamese and household income with householder between the ages 45 and 64 in the United States with a correlation coefficient (R) of -0.420 and weighted average of $93,788, a difference of 3.9%.
Householder Income Ages 45 - 64 years Correlation Summary
| Measurement | Barbadian | Vietnamese |
| Minimum | $26,458 | $2,499 |
| Maximum | $147,517 | $191,429 |
| Range | $121,059 | $188,930 |
| Mean | $88,874 | $99,011 |
| Median | $92,167 | $94,156 |
| Interquartile 25% (IQ1) | $75,253 | $77,796 |
| Interquartile 75% (IQ3) | $97,931 | $119,213 |
| Interquartile Range (IQR) | $22,678 | $41,417 |
| Standard Deviation (Sample) | $22,976 | $34,793 |
| Standard Deviation (Population) | $22,787 | $34,563 |
Similar Demographics by Householder Income Ages 45 - 64 years
Demographics Similar to Barbadians by Householder Income Ages 45 - 64 years
In terms of householder income ages 45 - 64 years, the demographic groups most similar to Barbadians are Immigrants from Guyana ($90,186, a difference of 0.090%), Marshallese ($90,455, a difference of 0.21%), American ($90,536, a difference of 0.30%), West Indian ($89,906, a difference of 0.40%), and Subsaharan African ($90,691, a difference of 0.47%).
| Demographics | Rating | Rank | Householder Income Ages 45 - 64 years |
| Central Americans | 0.9 /100 | #246 | Tragic $90,951 |
| Alaskan Athabascans | 0.9 /100 | #247 | Tragic $90,951 |
| Immigrants | Laos | 0.9 /100 | #248 | Tragic $90,909 |
| Mexican American Indians | 0.8 /100 | #249 | Tragic $90,811 |
| Sub-Saharan Africans | 0.8 /100 | #250 | Tragic $90,691 |
| Americans | 0.7 /100 | #251 | Tragic $90,536 |
| Marshallese | 0.7 /100 | #252 | Tragic $90,455 |
| Barbadians | 0.6 /100 | #253 | Tragic $90,266 |
| Immigrants | Guyana | 0.6 /100 | #254 | Tragic $90,186 |
| West Indians | 0.5 /100 | #255 | Tragic $89,906 |
| French American Indians | 0.5 /100 | #256 | Tragic $89,811 |
| German Russians | 0.4 /100 | #257 | Tragic $89,398 |
| Immigrants | Barbados | 0.4 /100 | #258 | Tragic $89,394 |
| Immigrants | Nicaragua | 0.4 /100 | #259 | Tragic $89,108 |
| Liberians | 0.3 /100 | #260 | Tragic $88,929 |
Demographics Similar to Vietnamese by Householder Income Ages 45 - 64 years
In terms of householder income ages 45 - 64 years, the demographic groups most similar to Vietnamese are Immigrants from Sudan ($93,781, a difference of 0.010%), Immigrants from Panama ($93,815, a difference of 0.030%), Ecuadorian ($93,739, a difference of 0.050%), Sudanese ($93,718, a difference of 0.070%), and Alaska Native ($93,991, a difference of 0.22%).
| Demographics | Rating | Rank | Householder Income Ages 45 - 64 years |
| Malaysians | 5.2 /100 | #222 | Tragic $94,517 |
| Immigrants | Nonimmigrants | 5.0 /100 | #223 | Tragic $94,448 |
| Immigrants | Bosnia and Herzegovina | 4.6 /100 | #224 | Tragic $94,288 |
| Bermudans | 4.4 /100 | #225 | Tragic $94,197 |
| Immigrants | Azores | 4.3 /100 | #226 | Tragic $94,138 |
| Alaska Natives | 4.0 /100 | #227 | Tragic $93,991 |
| Immigrants | Panama | 3.7 /100 | #228 | Tragic $93,815 |
| Vietnamese | 3.6 /100 | #229 | Tragic $93,788 |
| Immigrants | Sudan | 3.6 /100 | #230 | Tragic $93,781 |
| Ecuadorians | 3.6 /100 | #231 | Tragic $93,739 |
| Sudanese | 3.5 /100 | #232 | Tragic $93,718 |
| Nepalese | 3.0 /100 | #233 | Tragic $93,355 |
| Immigrants | El Salvador | 2.7 /100 | #234 | Tragic $93,176 |
| Nicaraguans | 2.0 /100 | #235 | Tragic $92,554 |
| Immigrants | Western Africa | 1.8 /100 | #236 | Tragic $92,384 |