Immigrants from Trinidad and Tobago vs Vietnamese Cognitive Disability
COMPARE
Immigrants from Trinidad and Tobago
Vietnamese
Cognitive Disability
Cognitive Disability Comparison
Immigrants from Trinidad and Tobago
Vietnamese
17.6%
COGNITIVE DISABILITY
8.7/ 100
METRIC RATING
209th/ 347
METRIC RANK
17.7%
COGNITIVE DISABILITY
3.4/ 100
METRIC RATING
225th/ 347
METRIC RANK
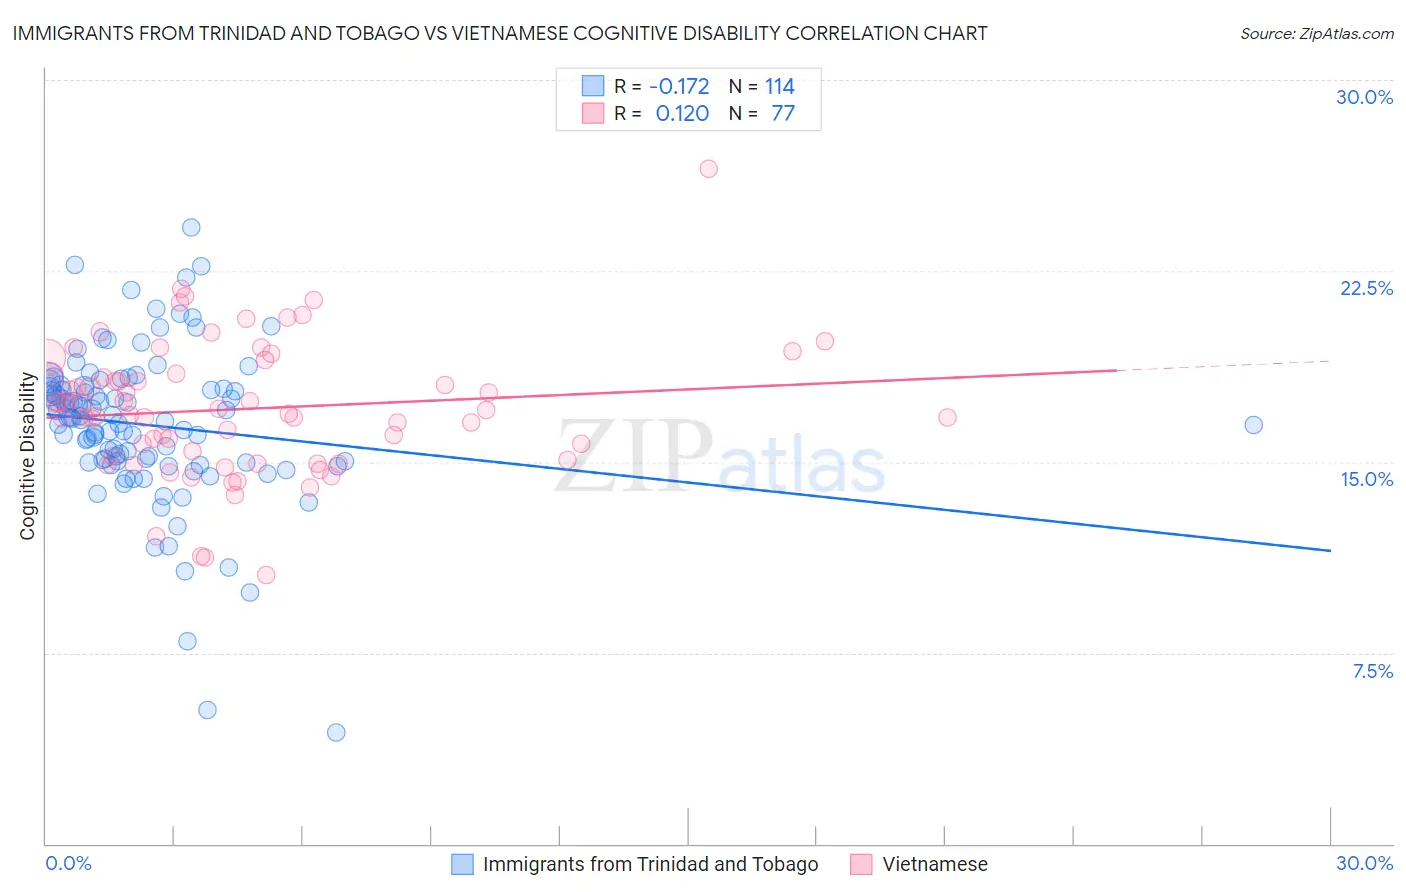
Immigrants from Trinidad and Tobago vs Vietnamese Cognitive Disability Correlation Chart
The statistical analysis conducted on geographies consisting of 223,500,397 people shows a poor negative correlation between the proportion of Immigrants from Trinidad and Tobago and percentage of population with cognitive disability in the United States with a correlation coefficient (R) of -0.172 and weighted average of 17.6%. Similarly, the statistical analysis conducted on geographies consisting of 170,756,377 people shows a poor positive correlation between the proportion of Vietnamese and percentage of population with cognitive disability in the United States with a correlation coefficient (R) of 0.120 and weighted average of 17.7%, a difference of 0.70%.
Cognitive Disability Correlation Summary
| Measurement | Immigrants from Trinidad and Tobago | Vietnamese |
| Minimum | 4.4% | 10.6% |
| Maximum | 24.2% | 26.5% |
| Range | 19.8% | 15.9% |
| Mean | 16.4% | 17.1% |
| Median | 16.7% | 16.9% |
| Interquartile 25% (IQ1) | 15.0% | 15.2% |
| Interquartile 75% (IQ3) | 17.9% | 18.5% |
| Interquartile Range (IQR) | 2.9% | 3.3% |
| Standard Deviation (Sample) | 3.0% | 2.6% |
| Standard Deviation (Population) | 3.0% | 2.6% |
Demographics Similar to Immigrants from Trinidad and Tobago and Vietnamese by Cognitive Disability
In terms of cognitive disability, the demographic groups most similar to Immigrants from Trinidad and Tobago are Immigrants from Jamaica (17.6%, a difference of 0.020%), Immigrants from Cameroon (17.6%, a difference of 0.050%), Immigrants from Latin America (17.6%, a difference of 0.080%), Taiwanese (17.6%, a difference of 0.090%), and Immigrants from Oceania (17.6%, a difference of 0.13%). Similarly, the demographic groups most similar to Vietnamese are Fijian (17.7%, a difference of 0.010%), Marshallese (17.7%, a difference of 0.16%), Immigrants from St. Vincent and the Grenadines (17.7%, a difference of 0.19%), Alsatian (17.7%, a difference of 0.20%), and Central American (17.7%, a difference of 0.21%).
| Demographics | Rating | Rank | Cognitive Disability |
| Immigrants | Latin America | 9.7 /100 | #207 | Tragic 17.6% |
| Immigrants | Cameroon | 9.3 /100 | #208 | Tragic 17.6% |
| Immigrants | Trinidad and Tobago | 8.7 /100 | #209 | Tragic 17.6% |
| Immigrants | Jamaica | 8.5 /100 | #210 | Tragic 17.6% |
| Taiwanese | 7.7 /100 | #211 | Tragic 17.6% |
| Immigrants | Oceania | 7.3 /100 | #212 | Tragic 17.6% |
| Hawaiians | 7.2 /100 | #213 | Tragic 17.6% |
| Immigrants | El Salvador | 7.0 /100 | #214 | Tragic 17.6% |
| Alaskan Athabascans | 6.9 /100 | #215 | Tragic 17.6% |
| Okinawans | 6.8 /100 | #216 | Tragic 17.6% |
| Salvadorans | 6.7 /100 | #217 | Tragic 17.6% |
| Icelanders | 6.4 /100 | #218 | Tragic 17.6% |
| Immigrants | Sierra Leone | 6.3 /100 | #219 | Tragic 17.6% |
| Zimbabweans | 6.1 /100 | #220 | Tragic 17.6% |
| Moroccans | 5.9 /100 | #221 | Tragic 17.6% |
| Central Americans | 4.5 /100 | #222 | Tragic 17.7% |
| Alsatians | 4.5 /100 | #223 | Tragic 17.7% |
| Fijians | 3.4 /100 | #224 | Tragic 17.7% |
| Vietnamese | 3.4 /100 | #225 | Tragic 17.7% |
| Marshallese | 2.7 /100 | #226 | Tragic 17.7% |
| Immigrants | St. Vincent and the Grenadines | 2.6 /100 | #227 | Tragic 17.7% |