Immigrants from Trinidad and Tobago vs Yup'ik Householder Income Ages 45 - 64 years
COMPARE
Immigrants from Trinidad and Tobago
Yup'ik
Householder Income Ages 45 - 64 years
Householder Income Ages 45 - 64 years Comparison
Immigrants from Trinidad and Tobago
Yup'ik
$91,347
HOUSEHOLDER INCOME AGES 45 - 64 YEARS
1.1/ 100
METRIC RATING
243rd/ 347
METRIC RANK
$81,000
HOUSEHOLDER INCOME AGES 45 - 64 YEARS
0.0/ 100
METRIC RATING
324th/ 347
METRIC RANK
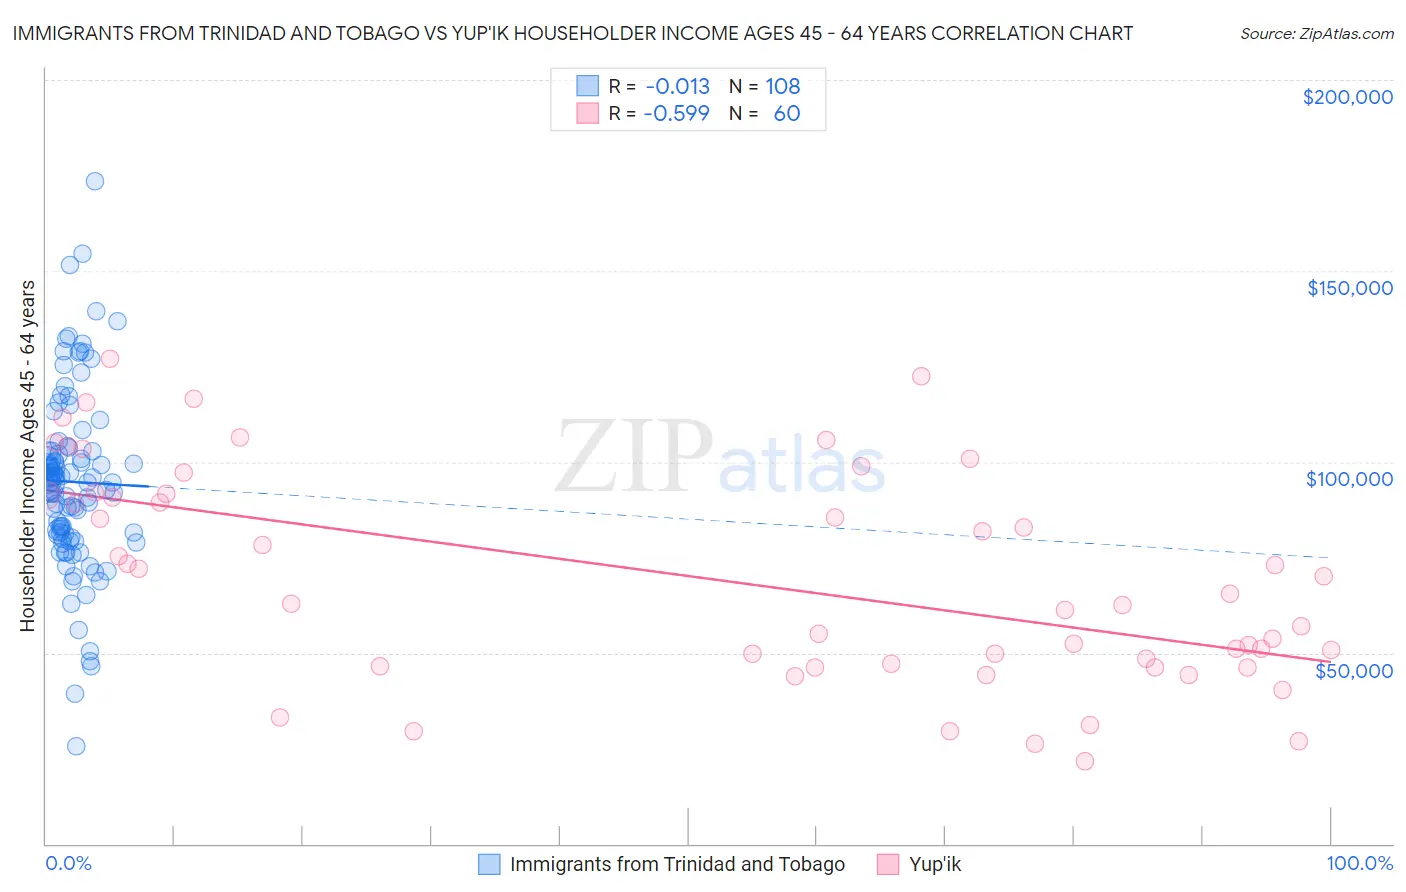
Immigrants from Trinidad and Tobago vs Yup'ik Householder Income Ages 45 - 64 years Correlation Chart
The statistical analysis conducted on geographies consisting of 223,374,327 people shows no correlation between the proportion of Immigrants from Trinidad and Tobago and household income with householder between the ages 45 and 64 in the United States with a correlation coefficient (R) of -0.013 and weighted average of $91,347. Similarly, the statistical analysis conducted on geographies consisting of 39,943,055 people shows a substantial negative correlation between the proportion of Yup'ik and household income with householder between the ages 45 and 64 in the United States with a correlation coefficient (R) of -0.599 and weighted average of $81,000, a difference of 12.8%.
Householder Income Ages 45 - 64 years Correlation Summary
| Measurement | Immigrants from Trinidad and Tobago | Yup'ik |
| Minimum | $25,417 | $21,563 |
| Maximum | $173,438 | $127,108 |
| Range | $148,021 | $105,545 |
| Mean | $94,766 | $69,372 |
| Median | $94,630 | $64,271 |
| Interquartile 25% (IQ1) | $80,933 | $46,840 |
| Interquartile 75% (IQ3) | $102,864 | $91,495 |
| Interquartile Range (IQR) | $21,931 | $44,656 |
| Standard Deviation (Sample) | $23,554 | $27,859 |
| Standard Deviation (Population) | $23,445 | $27,626 |
Similar Demographics by Householder Income Ages 45 - 64 years
Demographics Similar to Immigrants from Trinidad and Tobago by Householder Income Ages 45 - 64 years
In terms of householder income ages 45 - 64 years, the demographic groups most similar to Immigrants from Trinidad and Tobago are Trinidadian and Tobagonian ($91,357, a difference of 0.010%), Inupiat ($91,355, a difference of 0.010%), Immigrants from Burma/Myanmar ($91,385, a difference of 0.040%), Immigrants from Middle Africa ($91,293, a difference of 0.060%), and Immigrants from Ecuador ($91,462, a difference of 0.13%).
| Demographics | Rating | Rank | Householder Income Ages 45 - 64 years |
| Immigrants | Western Africa | 1.8 /100 | #236 | Tragic $92,384 |
| Immigrants | Bangladesh | 1.7 /100 | #237 | Tragic $92,208 |
| Pennsylvania Germans | 1.5 /100 | #238 | Tragic $91,956 |
| Immigrants | Ecuador | 1.2 /100 | #239 | Tragic $91,462 |
| Immigrants | Burma/Myanmar | 1.1 /100 | #240 | Tragic $91,385 |
| Trinidadians and Tobagonians | 1.1 /100 | #241 | Tragic $91,357 |
| Inupiat | 1.1 /100 | #242 | Tragic $91,355 |
| Immigrants | Trinidad and Tobago | 1.1 /100 | #243 | Tragic $91,347 |
| Immigrants | Middle Africa | 1.1 /100 | #244 | Tragic $91,293 |
| Guyanese | 0.9 /100 | #245 | Tragic $90,966 |
| Central Americans | 0.9 /100 | #246 | Tragic $90,951 |
| Alaskan Athabascans | 0.9 /100 | #247 | Tragic $90,951 |
| Immigrants | Laos | 0.9 /100 | #248 | Tragic $90,909 |
| Mexican American Indians | 0.8 /100 | #249 | Tragic $90,811 |
| Sub-Saharan Africans | 0.8 /100 | #250 | Tragic $90,691 |
Demographics Similar to Yup'ik by Householder Income Ages 45 - 64 years
In terms of householder income ages 45 - 64 years, the demographic groups most similar to Yup'ik are Immigrants from Cuba ($80,662, a difference of 0.42%), Bahamian ($81,369, a difference of 0.46%), Dominican ($80,623, a difference of 0.47%), Sioux ($81,750, a difference of 0.93%), and Seminole ($80,077, a difference of 1.1%).
| Demographics | Rating | Rank | Householder Income Ages 45 - 64 years |
| Colville | 0.0 /100 | #317 | Tragic $82,474 |
| Choctaw | 0.0 /100 | #318 | Tragic $82,287 |
| Chickasaw | 0.0 /100 | #319 | Tragic $82,193 |
| Apache | 0.0 /100 | #320 | Tragic $82,184 |
| Yuman | 0.0 /100 | #321 | Tragic $82,139 |
| Sioux | 0.0 /100 | #322 | Tragic $81,750 |
| Bahamians | 0.0 /100 | #323 | Tragic $81,369 |
| Yup'ik | 0.0 /100 | #324 | Tragic $81,000 |
| Immigrants | Cuba | 0.0 /100 | #325 | Tragic $80,662 |
| Dominicans | 0.0 /100 | #326 | Tragic $80,623 |
| Seminole | 0.0 /100 | #327 | Tragic $80,077 |
| Natives/Alaskans | 0.0 /100 | #328 | Tragic $79,816 |
| Dutch West Indians | 0.0 /100 | #329 | Tragic $79,171 |
| Creek | 0.0 /100 | #330 | Tragic $78,960 |
| Immigrants | Dominican Republic | 0.0 /100 | #331 | Tragic $78,836 |