Immigrants from Denmark vs Vietnamese Householder Income Ages 45 - 64 years
COMPARE
Immigrants from Denmark
Vietnamese
Householder Income Ages 45 - 64 years
Householder Income Ages 45 - 64 years Comparison
Immigrants from Denmark
Vietnamese
$116,000
HOUSEHOLDER INCOME AGES 45 - 64 YEARS
100.0/ 100
METRIC RATING
34th/ 347
METRIC RANK
$93,788
HOUSEHOLDER INCOME AGES 45 - 64 YEARS
3.6/ 100
METRIC RATING
229th/ 347
METRIC RANK
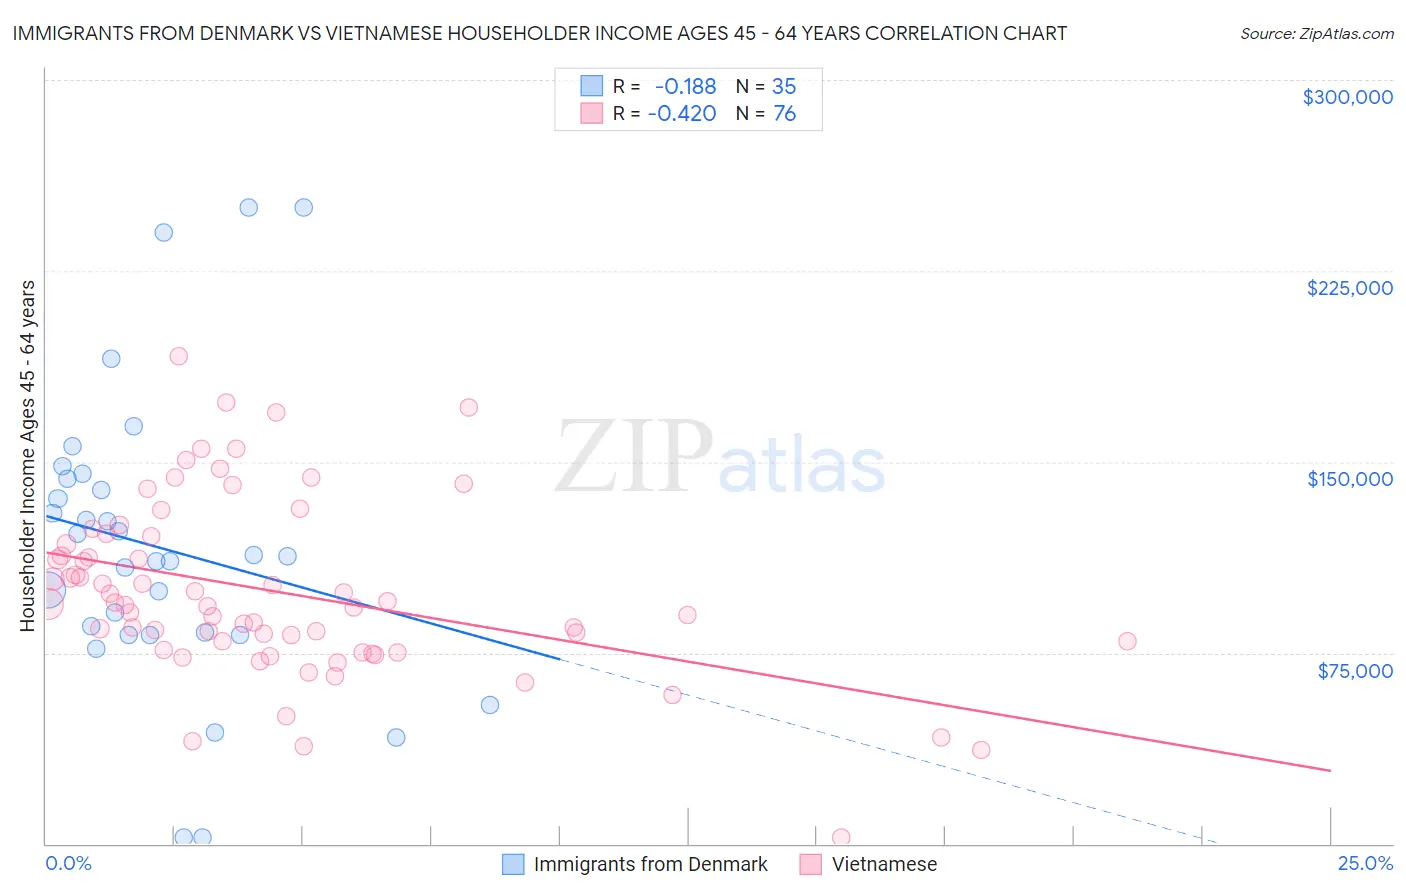
Immigrants from Denmark vs Vietnamese Householder Income Ages 45 - 64 years Correlation Chart
The statistical analysis conducted on geographies consisting of 136,366,596 people shows a poor negative correlation between the proportion of Immigrants from Denmark and household income with householder between the ages 45 and 64 in the United States with a correlation coefficient (R) of -0.188 and weighted average of $116,000. Similarly, the statistical analysis conducted on geographies consisting of 170,554,464 people shows a moderate negative correlation between the proportion of Vietnamese and household income with householder between the ages 45 and 64 in the United States with a correlation coefficient (R) of -0.420 and weighted average of $93,788, a difference of 23.7%.
Householder Income Ages 45 - 64 years Correlation Summary
| Measurement | Immigrants from Denmark | Vietnamese |
| Minimum | $2,499 | $2,499 |
| Maximum | $250,001 | $191,429 |
| Range | $247,502 | $188,930 |
| Mean | $116,363 | $99,011 |
| Median | $112,813 | $94,156 |
| Interquartile 25% (IQ1) | $81,964 | $77,796 |
| Interquartile 75% (IQ3) | $143,426 | $119,213 |
| Interquartile Range (IQR) | $61,462 | $41,417 |
| Standard Deviation (Sample) | $57,800 | $34,793 |
| Standard Deviation (Population) | $56,968 | $34,563 |
Similar Demographics by Householder Income Ages 45 - 64 years
Demographics Similar to Immigrants from Denmark by Householder Income Ages 45 - 64 years
In terms of householder income ages 45 - 64 years, the demographic groups most similar to Immigrants from Denmark are Latvian ($115,957, a difference of 0.040%), Immigrants from Switzerland ($115,934, a difference of 0.060%), Chinese ($116,156, a difference of 0.13%), Russian ($116,328, a difference of 0.28%), and Immigrants from Asia ($116,566, a difference of 0.49%).
| Demographics | Rating | Rank | Householder Income Ages 45 - 64 years |
| Immigrants | Northern Europe | 100.0 /100 | #27 | Exceptional $117,930 |
| Turks | 100.0 /100 | #28 | Exceptional $117,814 |
| Bhutanese | 100.0 /100 | #29 | Exceptional $117,750 |
| Immigrants | Bolivia | 100.0 /100 | #30 | Exceptional $117,731 |
| Immigrants | Asia | 100.0 /100 | #31 | Exceptional $116,566 |
| Russians | 100.0 /100 | #32 | Exceptional $116,328 |
| Chinese | 100.0 /100 | #33 | Exceptional $116,156 |
| Immigrants | Denmark | 100.0 /100 | #34 | Exceptional $116,000 |
| Latvians | 100.0 /100 | #35 | Exceptional $115,957 |
| Immigrants | Switzerland | 100.0 /100 | #36 | Exceptional $115,934 |
| Maltese | 99.9 /100 | #37 | Exceptional $114,754 |
| Immigrants | Pakistan | 99.9 /100 | #38 | Exceptional $114,434 |
| Immigrants | Turkey | 99.9 /100 | #39 | Exceptional $114,407 |
| Cambodians | 99.9 /100 | #40 | Exceptional $114,342 |
| Immigrants | Lithuania | 99.9 /100 | #41 | Exceptional $114,336 |
Demographics Similar to Vietnamese by Householder Income Ages 45 - 64 years
In terms of householder income ages 45 - 64 years, the demographic groups most similar to Vietnamese are Immigrants from Sudan ($93,781, a difference of 0.010%), Immigrants from Panama ($93,815, a difference of 0.030%), Ecuadorian ($93,739, a difference of 0.050%), Sudanese ($93,718, a difference of 0.070%), and Alaska Native ($93,991, a difference of 0.22%).
| Demographics | Rating | Rank | Householder Income Ages 45 - 64 years |
| Malaysians | 5.2 /100 | #222 | Tragic $94,517 |
| Immigrants | Nonimmigrants | 5.0 /100 | #223 | Tragic $94,448 |
| Immigrants | Bosnia and Herzegovina | 4.6 /100 | #224 | Tragic $94,288 |
| Bermudans | 4.4 /100 | #225 | Tragic $94,197 |
| Immigrants | Azores | 4.3 /100 | #226 | Tragic $94,138 |
| Alaska Natives | 4.0 /100 | #227 | Tragic $93,991 |
| Immigrants | Panama | 3.7 /100 | #228 | Tragic $93,815 |
| Vietnamese | 3.6 /100 | #229 | Tragic $93,788 |
| Immigrants | Sudan | 3.6 /100 | #230 | Tragic $93,781 |
| Ecuadorians | 3.6 /100 | #231 | Tragic $93,739 |
| Sudanese | 3.5 /100 | #232 | Tragic $93,718 |
| Nepalese | 3.0 /100 | #233 | Tragic $93,355 |
| Immigrants | El Salvador | 2.7 /100 | #234 | Tragic $93,176 |
| Nicaraguans | 2.0 /100 | #235 | Tragic $92,554 |
| Immigrants | Western Africa | 1.8 /100 | #236 | Tragic $92,384 |