Immigrants from Trinidad and Tobago vs Vietnamese Median Household Income
COMPARE
Immigrants from Trinidad and Tobago
Vietnamese
Median Household Income
Median Household Income Comparison
Immigrants from Trinidad and Tobago
Vietnamese
$80,373
MEDIAN HOUSEHOLD INCOME
4.6/ 100
METRIC RATING
232nd/ 347
METRIC RANK
$82,248
MEDIAN HOUSEHOLD INCOME
13.8/ 100
METRIC RATING
215th/ 347
METRIC RANK
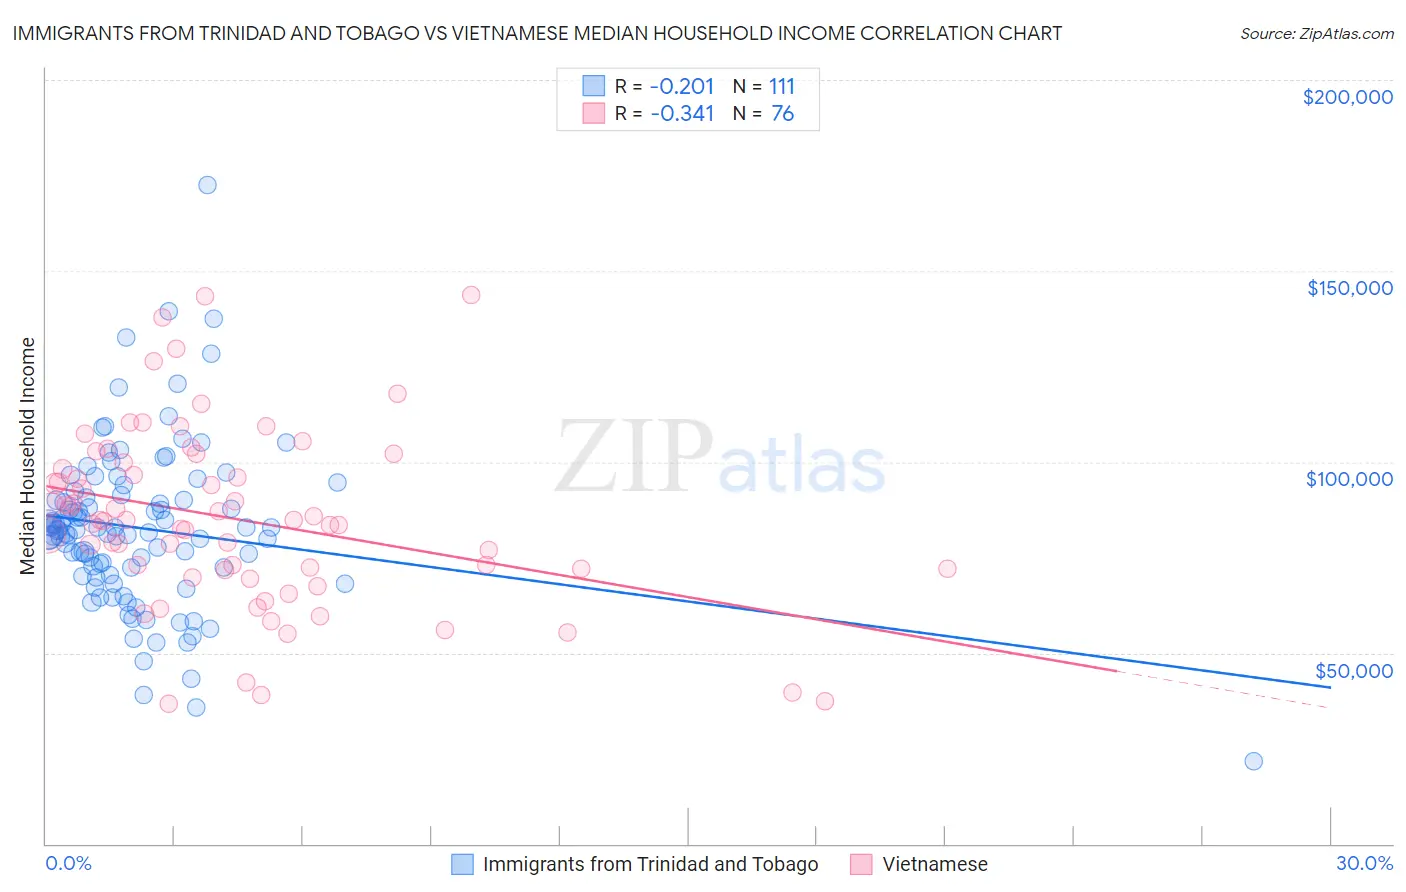
Immigrants from Trinidad and Tobago vs Vietnamese Median Household Income Correlation Chart
The statistical analysis conducted on geographies consisting of 223,468,612 people shows a weak negative correlation between the proportion of Immigrants from Trinidad and Tobago and median household income in the United States with a correlation coefficient (R) of -0.201 and weighted average of $80,373. Similarly, the statistical analysis conducted on geographies consisting of 170,624,806 people shows a mild negative correlation between the proportion of Vietnamese and median household income in the United States with a correlation coefficient (R) of -0.341 and weighted average of $82,248, a difference of 2.3%.
Median Household Income Correlation Summary
| Measurement | Immigrants from Trinidad and Tobago | Vietnamese |
| Minimum | $21,629 | $36,578 |
| Maximum | $172,500 | $143,859 |
| Range | $150,871 | $107,281 |
| Mean | $82,579 | $84,974 |
| Median | $82,052 | $84,533 |
| Interquartile 25% (IQ1) | $70,433 | $71,810 |
| Interquartile 75% (IQ3) | $91,223 | $98,943 |
| Interquartile Range (IQR) | $20,791 | $27,134 |
| Standard Deviation (Sample) | $21,636 | $23,335 |
| Standard Deviation (Population) | $21,539 | $23,181 |
Demographics Similar to Immigrants from Trinidad and Tobago and Vietnamese by Median Household Income
In terms of median household income, the demographic groups most similar to Immigrants from Trinidad and Tobago are Immigrants from the Azores ($80,357, a difference of 0.020%), Bermudan ($80,406, a difference of 0.040%), Trinidadian and Tobagonian ($80,402, a difference of 0.040%), Delaware ($80,527, a difference of 0.19%), and Immigrants from Bangladesh ($80,722, a difference of 0.43%). Similarly, the demographic groups most similar to Vietnamese are Panamanian ($82,272, a difference of 0.030%), Yugoslavian ($82,186, a difference of 0.070%), Nepalese ($82,410, a difference of 0.20%), Ecuadorian ($82,070, a difference of 0.22%), and White/Caucasian ($82,029, a difference of 0.27%).
| Demographics | Rating | Rank | Median Household Income |
| Nepalese | 15.1 /100 | #213 | Poor $82,410 |
| Panamanians | 14.0 /100 | #214 | Poor $82,272 |
| Vietnamese | 13.8 /100 | #215 | Poor $82,248 |
| Yugoslavians | 13.3 /100 | #216 | Poor $82,186 |
| Ecuadorians | 12.5 /100 | #217 | Poor $82,070 |
| Whites/Caucasians | 12.2 /100 | #218 | Poor $82,029 |
| Nigerians | 10.3 /100 | #219 | Poor $81,725 |
| Immigrants | Venezuela | 9.0 /100 | #220 | Tragic $81,506 |
| Immigrants | Ghana | 9.0 /100 | #221 | Tragic $81,489 |
| Immigrants | Nigeria | 7.7 /100 | #222 | Tragic $81,236 |
| Immigrants | El Salvador | 7.6 /100 | #223 | Tragic $81,213 |
| Malaysians | 7.0 /100 | #224 | Tragic $81,064 |
| Scotch-Irish | 6.6 /100 | #225 | Tragic $80,972 |
| Immigrants | Panama | 6.2 /100 | #226 | Tragic $80,873 |
| Guyanese | 5.7 /100 | #227 | Tragic $80,734 |
| Immigrants | Bangladesh | 5.7 /100 | #228 | Tragic $80,722 |
| Delaware | 5.0 /100 | #229 | Tragic $80,527 |
| Bermudans | 4.7 /100 | #230 | Tragic $80,406 |
| Trinidadians and Tobagonians | 4.7 /100 | #231 | Tragic $80,402 |
| Immigrants | Trinidad and Tobago | 4.6 /100 | #232 | Tragic $80,373 |
| Immigrants | Azores | 4.5 /100 | #233 | Tragic $80,357 |