Immigrants from Trinidad and Tobago vs Spanish American Householder Income Over 65 years
COMPARE
Immigrants from Trinidad and Tobago
Spanish American
Householder Income Over 65 years
Householder Income Over 65 years Comparison
Immigrants from Trinidad and Tobago
Spanish Americans
$55,598
HOUSEHOLDER INCOME OVER 65 YEARS
0.4/ 100
METRIC RATING
253rd/ 347
METRIC RANK
$57,021
HOUSEHOLDER INCOME OVER 65 YEARS
1.6/ 100
METRIC RATING
235th/ 347
METRIC RANK
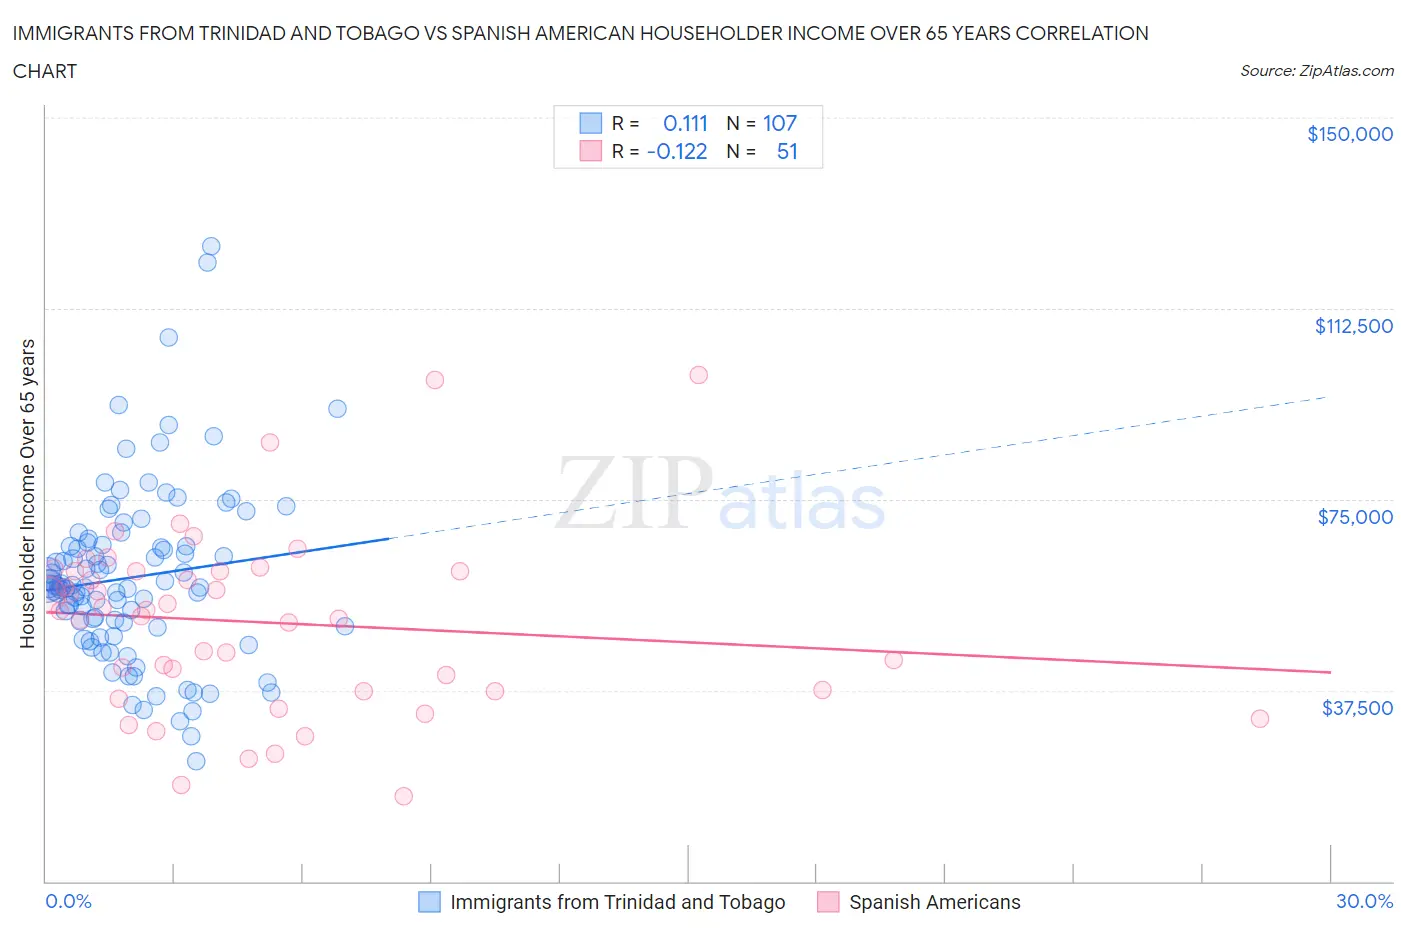
Immigrants from Trinidad and Tobago vs Spanish American Householder Income Over 65 years Correlation Chart
The statistical analysis conducted on geographies consisting of 223,183,074 people shows a poor positive correlation between the proportion of Immigrants from Trinidad and Tobago and household income with householder over the age of 65 in the United States with a correlation coefficient (R) of 0.111 and weighted average of $55,598. Similarly, the statistical analysis conducted on geographies consisting of 103,119,527 people shows a poor negative correlation between the proportion of Spanish Americans and household income with householder over the age of 65 in the United States with a correlation coefficient (R) of -0.122 and weighted average of $57,021, a difference of 2.6%.
Householder Income Over 65 years Correlation Summary
| Measurement | Immigrants from Trinidad and Tobago | Spanish American |
| Minimum | $23,659 | $16,667 |
| Maximum | $124,816 | $99,316 |
| Range | $101,157 | $82,649 |
| Mean | $59,659 | $50,862 |
| Median | $57,844 | $53,029 |
| Interquartile 25% (IQ1) | $50,192 | $37,400 |
| Interquartile 75% (IQ3) | $65,956 | $60,833 |
| Interquartile Range (IQR) | $15,764 | $23,433 |
| Standard Deviation (Sample) | $17,128 | $17,582 |
| Standard Deviation (Population) | $17,048 | $17,409 |
Demographics Similar to Immigrants from Trinidad and Tobago and Spanish Americans by Householder Income Over 65 years
In terms of householder income over 65 years, the demographic groups most similar to Immigrants from Trinidad and Tobago are American ($55,527, a difference of 0.13%), Osage ($55,677, a difference of 0.14%), Immigrants from Portugal ($55,924, a difference of 0.59%), Immigrants from Bosnia and Herzegovina ($55,986, a difference of 0.70%), and Mexican American Indian ($56,089, a difference of 0.88%). Similarly, the demographic groups most similar to Spanish Americans are Immigrants from Uruguay ($56,975, a difference of 0.080%), Immigrants from Panama ($56,944, a difference of 0.14%), Immigrants from Burma/Myanmar ($57,114, a difference of 0.16%), Fijian ($56,768, a difference of 0.45%), and Immigrants from Laos ($56,722, a difference of 0.53%).
| Demographics | Rating | Rank | Householder Income Over 65 years |
| Immigrants | Burma/Myanmar | 1.7 /100 | #234 | Tragic $57,114 |
| Spanish Americans | 1.6 /100 | #235 | Tragic $57,021 |
| Immigrants | Uruguay | 1.5 /100 | #236 | Tragic $56,975 |
| Immigrants | Panama | 1.5 /100 | #237 | Tragic $56,944 |
| Fijians | 1.2 /100 | #238 | Tragic $56,768 |
| Immigrants | Laos | 1.2 /100 | #239 | Tragic $56,722 |
| Sub-Saharan Africans | 1.0 /100 | #240 | Tragic $56,615 |
| Immigrants | Guyana | 0.9 /100 | #241 | Tragic $56,495 |
| Yaqui | 0.8 /100 | #242 | Tragic $56,417 |
| Guyanese | 0.8 /100 | #243 | Tragic $56,351 |
| Hmong | 0.8 /100 | #244 | Tragic $56,339 |
| Immigrants | Uzbekistan | 0.8 /100 | #245 | Tragic $56,331 |
| Central Americans | 0.8 /100 | #246 | Tragic $56,321 |
| Yakama | 0.7 /100 | #247 | Tragic $56,234 |
| Vietnamese | 0.6 /100 | #248 | Tragic $56,143 |
| Mexican American Indians | 0.6 /100 | #249 | Tragic $56,089 |
| Immigrants | Bosnia and Herzegovina | 0.5 /100 | #250 | Tragic $55,986 |
| Immigrants | Portugal | 0.5 /100 | #251 | Tragic $55,924 |
| Osage | 0.4 /100 | #252 | Tragic $55,677 |
| Immigrants | Trinidad and Tobago | 0.4 /100 | #253 | Tragic $55,598 |
| Americans | 0.3 /100 | #254 | Tragic $55,527 |