Tohono O'odham vs Japanese Median Female Earnings
COMPARE
Tohono O'odham
Japanese
Median Female Earnings
Median Female Earnings Comparison
Tohono O'odham
Japanese
$33,205
MEDIAN FEMALE EARNINGS
0.0/ 100
METRIC RATING
340th/ 347
METRIC RANK
$38,528
MEDIAN FEMALE EARNINGS
8.1/ 100
METRIC RATING
222nd/ 347
METRIC RANK
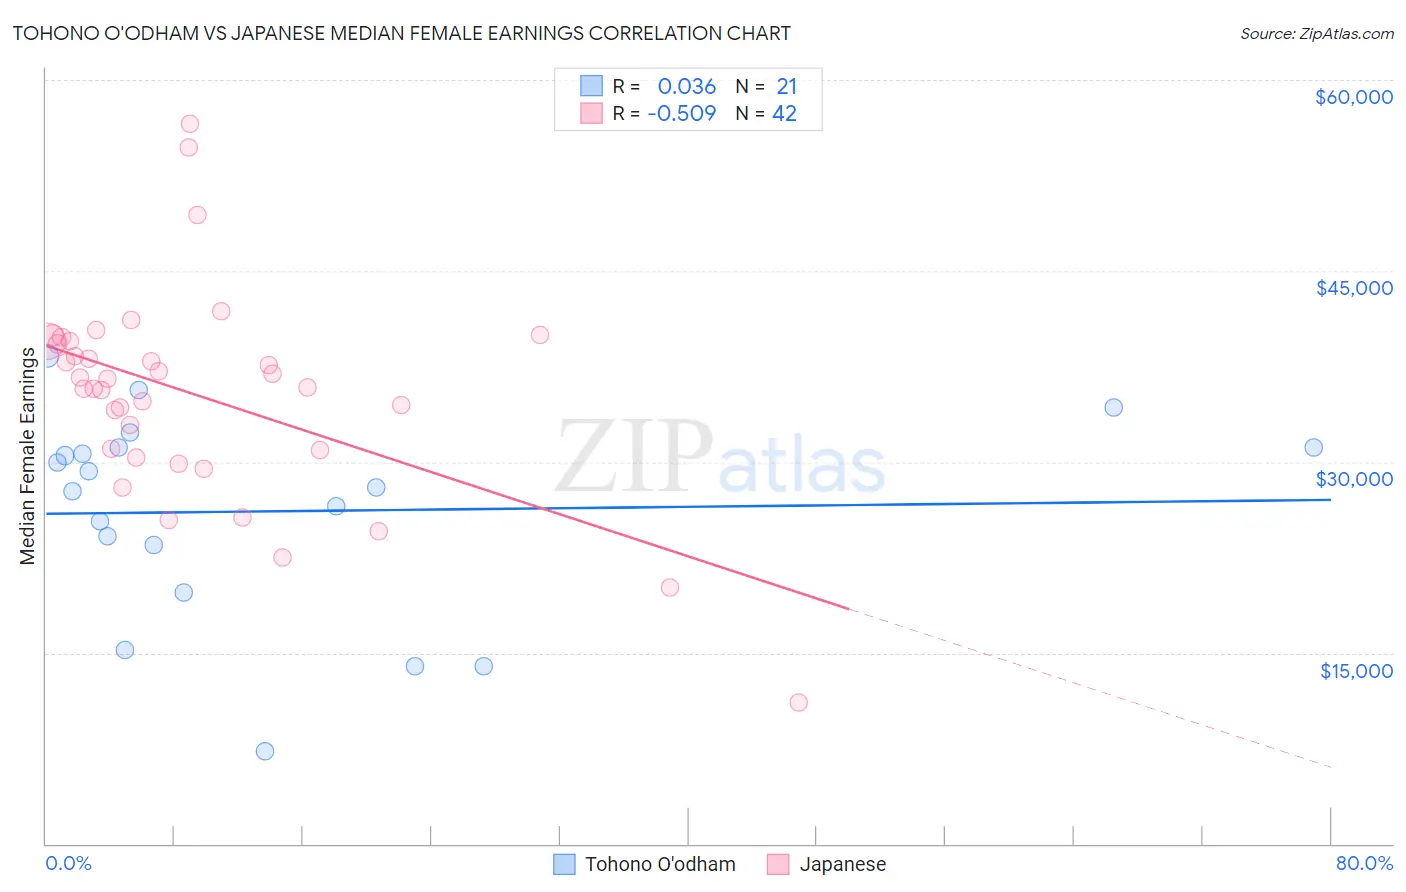
Tohono O'odham vs Japanese Median Female Earnings Correlation Chart
The statistical analysis conducted on geographies consisting of 58,716,616 people shows no correlation between the proportion of Tohono O'odham and median female earnings in the United States with a correlation coefficient (R) of 0.036 and weighted average of $33,205. Similarly, the statistical analysis conducted on geographies consisting of 249,158,779 people shows a substantial negative correlation between the proportion of Japanese and median female earnings in the United States with a correlation coefficient (R) of -0.509 and weighted average of $38,528, a difference of 16.0%.
Median Female Earnings Correlation Summary
| Measurement | Tohono O'odham | Japanese |
| Minimum | $7,287 | $11,066 |
| Maximum | $38,345 | $56,543 |
| Range | $31,058 | $45,477 |
| Mean | $26,118 | $35,269 |
| Median | $28,033 | $36,190 |
| Interquartile 25% (IQ1) | $21,596 | $30,918 |
| Interquartile 75% (IQ3) | $31,136 | $39,451 |
| Interquartile Range (IQR) | $9,540 | $8,533 |
| Standard Deviation (Sample) | $8,020 | $8,213 |
| Standard Deviation (Population) | $7,826 | $8,115 |
Similar Demographics by Median Female Earnings
Demographics Similar to Tohono O'odham by Median Female Earnings
In terms of median female earnings, the demographic groups most similar to Tohono O'odham are Immigrants from Mexico ($33,236, a difference of 0.090%), Immigrants from Cuba ($33,291, a difference of 0.26%), Yakama ($33,354, a difference of 0.45%), Navajo ($33,046, a difference of 0.48%), and Ottawa ($33,378, a difference of 0.52%).
| Demographics | Rating | Rank | Median Female Earnings |
| Mexicans | 0.0 /100 | #333 | Tragic $33,664 |
| Spanish American Indians | 0.0 /100 | #334 | Tragic $33,625 |
| Creek | 0.0 /100 | #335 | Tragic $33,437 |
| Ottawa | 0.0 /100 | #336 | Tragic $33,378 |
| Yakama | 0.0 /100 | #337 | Tragic $33,354 |
| Immigrants | Cuba | 0.0 /100 | #338 | Tragic $33,291 |
| Immigrants | Mexico | 0.0 /100 | #339 | Tragic $33,236 |
| Tohono O'odham | 0.0 /100 | #340 | Tragic $33,205 |
| Navajo | 0.0 /100 | #341 | Tragic $33,046 |
| Yup'ik | 0.0 /100 | #342 | Tragic $32,730 |
| Pueblo | 0.0 /100 | #343 | Tragic $32,564 |
| Lumbee | 0.0 /100 | #344 | Tragic $32,500 |
| Puerto Ricans | 0.0 /100 | #345 | Tragic $31,560 |
| Arapaho | 0.0 /100 | #346 | Tragic $31,489 |
| Houma | 0.0 /100 | #347 | Tragic $30,343 |
Demographics Similar to Japanese by Median Female Earnings
In terms of median female earnings, the demographic groups most similar to Japanese are Immigrants from Sudan ($38,511, a difference of 0.040%), Yugoslavian ($38,573, a difference of 0.12%), Immigrants from the Azores ($38,573, a difference of 0.12%), Native Hawaiian ($38,461, a difference of 0.17%), and Nepalese ($38,603, a difference of 0.19%).
| Demographics | Rating | Rank | Median Female Earnings |
| Spaniards | 10.3 /100 | #215 | Poor $38,656 |
| Immigrants | Ecuador | 10.1 /100 | #216 | Poor $38,644 |
| Immigrants | Jamaica | 9.7 /100 | #217 | Tragic $38,625 |
| Cape Verdeans | 9.5 /100 | #218 | Tragic $38,614 |
| Nepalese | 9.3 /100 | #219 | Tragic $38,603 |
| Yugoslavians | 8.8 /100 | #220 | Tragic $38,573 |
| Immigrants | Azores | 8.8 /100 | #221 | Tragic $38,573 |
| Japanese | 8.1 /100 | #222 | Tragic $38,528 |
| Immigrants | Sudan | 7.8 /100 | #223 | Tragic $38,511 |
| Native Hawaiians | 7.1 /100 | #224 | Tragic $38,461 |
| French | 7.0 /100 | #225 | Tragic $38,457 |
| French Canadians | 6.8 /100 | #226 | Tragic $38,436 |
| Scottish | 6.3 /100 | #227 | Tragic $38,397 |
| Sub-Saharan Africans | 6.2 /100 | #228 | Tragic $38,391 |
| Belgians | 6.1 /100 | #229 | Tragic $38,382 |