Immigrants from Switzerland vs Japanese Family Households with Children
COMPARE
Immigrants from Switzerland
Japanese
Family Households with Children
Family Households with Children Comparison
Immigrants from Switzerland
Japanese
25.7%
FAMILY HOUSEHOLDS WITH CHILDREN
0.0/ 100
METRIC RATING
333rd/ 347
METRIC RANK
29.4%
FAMILY HOUSEHOLDS WITH CHILDREN
100.0/ 100
METRIC RATING
31st/ 347
METRIC RANK
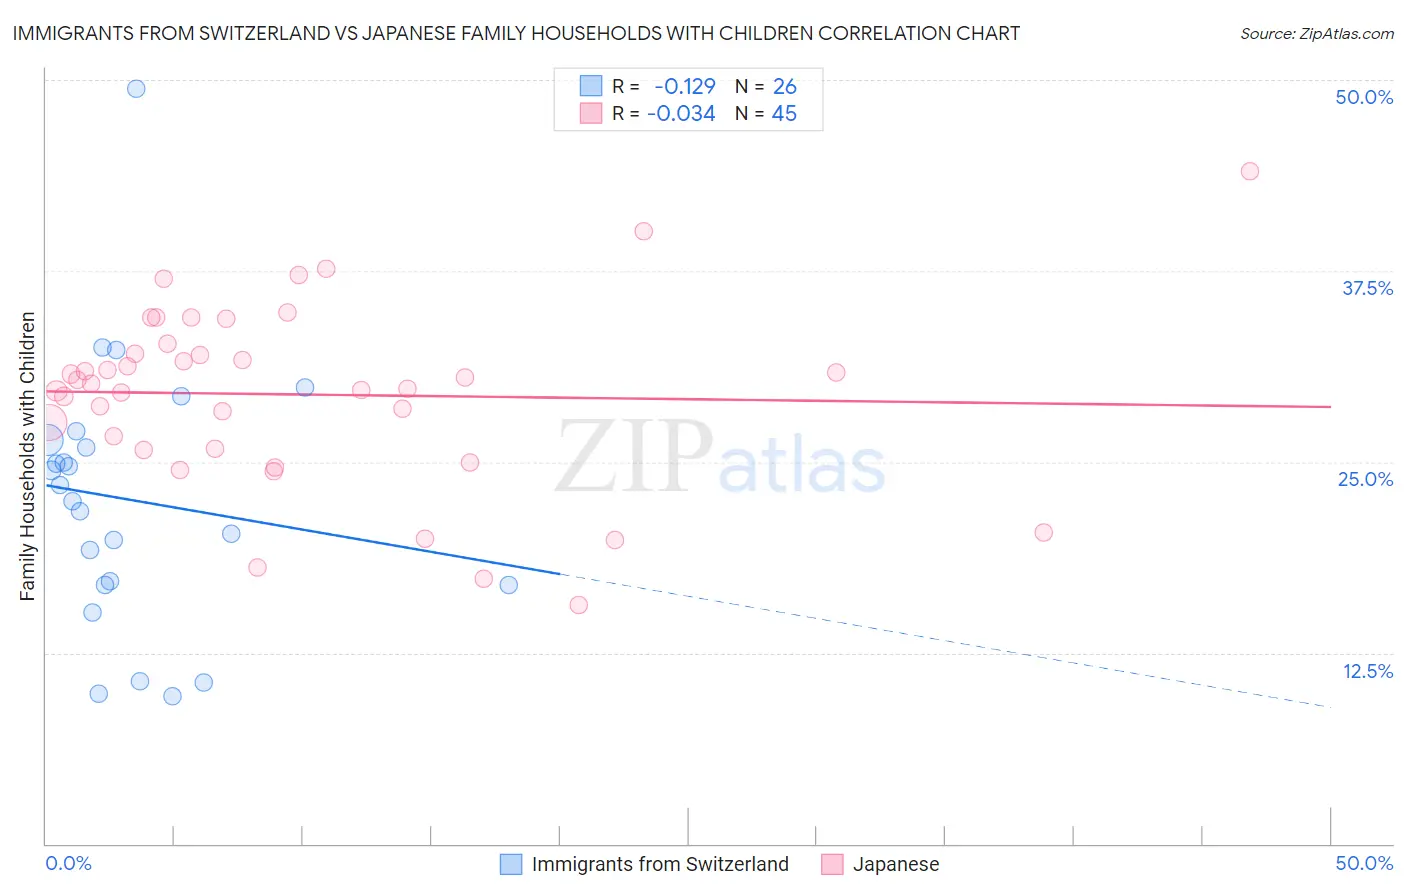
Immigrants from Switzerland vs Japanese Family Households with Children Correlation Chart
The statistical analysis conducted on geographies consisting of 148,054,749 people shows a poor negative correlation between the proportion of Immigrants from Switzerland and percentage of family households with children in the United States with a correlation coefficient (R) of -0.129 and weighted average of 25.7%. Similarly, the statistical analysis conducted on geographies consisting of 249,052,059 people shows no correlation between the proportion of Japanese and percentage of family households with children in the United States with a correlation coefficient (R) of -0.034 and weighted average of 29.4%, a difference of 14.4%.
Family Households with Children Correlation Summary
| Measurement | Immigrants from Switzerland | Japanese |
| Minimum | 9.6% | 15.6% |
| Maximum | 49.4% | 44.0% |
| Range | 39.8% | 28.4% |
| Mean | 22.5% | 29.4% |
| Median | 22.9% | 30.1% |
| Interquartile 25% (IQ1) | 17.0% | 25.8% |
| Interquartile 75% (IQ3) | 26.4% | 32.4% |
| Interquartile Range (IQR) | 9.5% | 6.6% |
| Standard Deviation (Sample) | 8.6% | 5.9% |
| Standard Deviation (Population) | 8.5% | 5.9% |
Similar Demographics by Family Households with Children
Demographics Similar to Immigrants from Switzerland by Family Households with Children
In terms of family households with children, the demographic groups most similar to Immigrants from Switzerland are Immigrants from Austria (25.8%, a difference of 0.080%), Slovak (25.7%, a difference of 0.15%), Immigrants from Croatia (25.7%, a difference of 0.16%), Immigrants from West Indies (25.7%, a difference of 0.26%), and Slovene (25.8%, a difference of 0.31%).
| Demographics | Rating | Rank | Family Households with Children |
| Immigrants | Ireland | 0.0 /100 | #326 | Tragic 26.0% |
| Immigrants | Barbados | 0.0 /100 | #327 | Tragic 26.0% |
| Immigrants | Albania | 0.0 /100 | #328 | Tragic 25.9% |
| Cypriots | 0.0 /100 | #329 | Tragic 25.9% |
| Immigrants | Latvia | 0.0 /100 | #330 | Tragic 25.9% |
| Slovenes | 0.0 /100 | #331 | Tragic 25.8% |
| Immigrants | Austria | 0.0 /100 | #332 | Tragic 25.8% |
| Immigrants | Switzerland | 0.0 /100 | #333 | Tragic 25.7% |
| Slovaks | 0.0 /100 | #334 | Tragic 25.7% |
| Immigrants | Croatia | 0.0 /100 | #335 | Tragic 25.7% |
| Immigrants | West Indies | 0.0 /100 | #336 | Tragic 25.7% |
| Puerto Ricans | 0.0 /100 | #337 | Tragic 25.6% |
| Arapaho | 0.0 /100 | #338 | Tragic 25.6% |
| Immigrants | St. Vincent and the Grenadines | 0.0 /100 | #339 | Tragic 25.6% |
| Immigrants | Armenia | 0.0 /100 | #340 | Tragic 25.6% |
Demographics Similar to Japanese by Family Households with Children
In terms of family households with children, the demographic groups most similar to Japanese are Immigrants from Yemen (29.4%, a difference of 0.060%), Yuman (29.5%, a difference of 0.14%), Samoan (29.5%, a difference of 0.18%), Bolivian (29.5%, a difference of 0.18%), and Venezuelan (29.4%, a difference of 0.26%).
| Demographics | Rating | Rank | Family Households with Children |
| Guamanians/Chamorros | 100.0 /100 | #24 | Exceptional 29.7% |
| Immigrants | Latin America | 100.0 /100 | #25 | Exceptional 29.7% |
| Sri Lankans | 100.0 /100 | #26 | Exceptional 29.5% |
| Immigrants | Vietnam | 100.0 /100 | #27 | Exceptional 29.5% |
| Samoans | 100.0 /100 | #28 | Exceptional 29.5% |
| Bolivians | 100.0 /100 | #29 | Exceptional 29.5% |
| Yuman | 100.0 /100 | #30 | Exceptional 29.5% |
| Japanese | 100.0 /100 | #31 | Exceptional 29.4% |
| Immigrants | Yemen | 100.0 /100 | #32 | Exceptional 29.4% |
| Venezuelans | 100.0 /100 | #33 | Exceptional 29.4% |
| Immigrants | Bolivia | 100.0 /100 | #34 | Exceptional 29.3% |
| Immigrants | Sierra Leone | 100.0 /100 | #35 | Exceptional 29.3% |
| Immigrants | Venezuela | 100.0 /100 | #36 | Exceptional 29.3% |
| Immigrants | Cameroon | 100.0 /100 | #37 | Exceptional 29.2% |
| Koreans | 100.0 /100 | #38 | Exceptional 29.2% |