Immigrants from West Indies vs Colville Householder Income Ages 25 - 44 years
COMPARE
Immigrants from West Indies
Colville
Householder Income Ages 25 - 44 years
Householder Income Ages 25 - 44 years Comparison
Immigrants from West Indies
Colville
$87,063
HOUSEHOLDER INCOME AGES 25 - 44 YEARS
1.5/ 100
METRIC RATING
243rd/ 347
METRIC RANK
$82,604
HOUSEHOLDER INCOME AGES 25 - 44 YEARS
0.1/ 100
METRIC RATING
280th/ 347
METRIC RANK
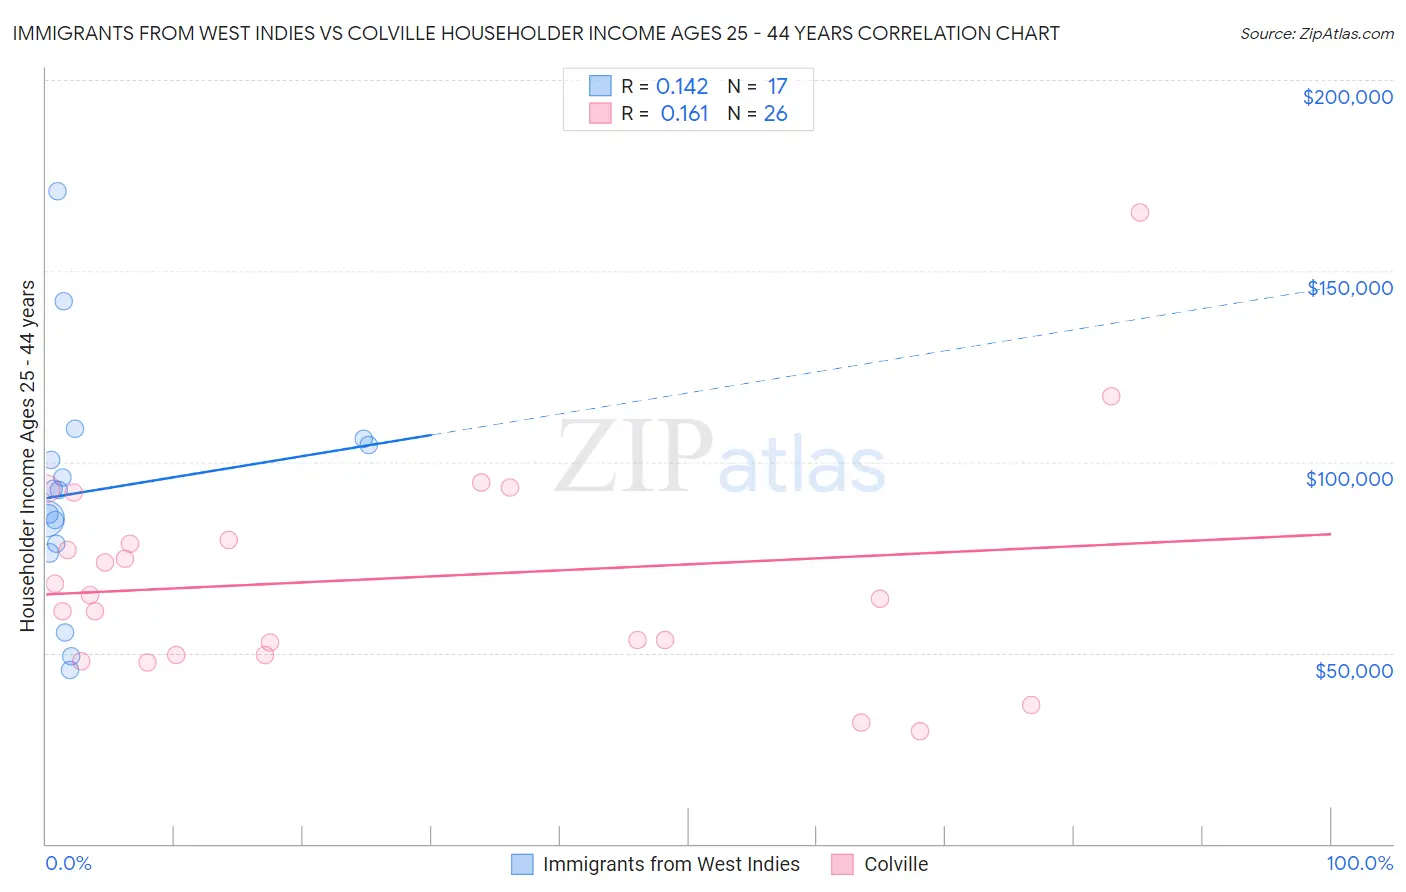
Immigrants from West Indies vs Colville Householder Income Ages 25 - 44 years Correlation Chart
The statistical analysis conducted on geographies consisting of 72,445,724 people shows a poor positive correlation between the proportion of Immigrants from West Indies and household income with householder between the ages 25 and 44 in the United States with a correlation coefficient (R) of 0.142 and weighted average of $87,063. Similarly, the statistical analysis conducted on geographies consisting of 34,657,772 people shows a poor positive correlation between the proportion of Colville and household income with householder between the ages 25 and 44 in the United States with a correlation coefficient (R) of 0.161 and weighted average of $82,604, a difference of 5.4%.
Householder Income Ages 25 - 44 years Correlation Summary
| Measurement | Immigrants from West Indies | Colville |
| Minimum | $45,500 | $29,375 |
| Maximum | $170,707 | $165,278 |
| Range | $125,207 | $135,903 |
| Mean | $92,620 | $69,577 |
| Median | $92,679 | $64,641 |
| Interquartile 25% (IQ1) | $77,312 | $49,583 |
| Interquartile 75% (IQ3) | $105,207 | $79,688 |
| Interquartile Range (IQR) | $27,895 | $30,105 |
| Standard Deviation (Sample) | $30,962 | $28,891 |
| Standard Deviation (Population) | $30,037 | $28,330 |
Similar Demographics by Householder Income Ages 25 - 44 years
Demographics Similar to Immigrants from West Indies by Householder Income Ages 25 - 44 years
In terms of householder income ages 25 - 44 years, the demographic groups most similar to Immigrants from West Indies are Immigrants from Venezuela ($87,038, a difference of 0.030%), West Indian ($87,205, a difference of 0.16%), Immigrants from El Salvador ($86,913, a difference of 0.17%), Immigrants from Burma/Myanmar ($86,736, a difference of 0.38%), and Immigrants from Nigeria ($86,589, a difference of 0.55%).
| Demographics | Rating | Rank | Householder Income Ages 25 - 44 years |
| Immigrants | Cameroon | 2.9 /100 | #236 | Tragic $88,214 |
| Salvadorans | 2.8 /100 | #237 | Tragic $88,198 |
| Alaska Natives | 2.6 /100 | #238 | Tragic $88,018 |
| Immigrants | Ghana | 2.2 /100 | #239 | Tragic $87,760 |
| Nicaraguans | 2.2 /100 | #240 | Tragic $87,751 |
| Nigerians | 2.2 /100 | #241 | Tragic $87,730 |
| West Indians | 1.7 /100 | #242 | Tragic $87,205 |
| Immigrants | West Indies | 1.5 /100 | #243 | Tragic $87,063 |
| Immigrants | Venezuela | 1.5 /100 | #244 | Tragic $87,038 |
| Immigrants | El Salvador | 1.4 /100 | #245 | Tragic $86,913 |
| Immigrants | Burma/Myanmar | 1.3 /100 | #246 | Tragic $86,736 |
| Immigrants | Nigeria | 1.2 /100 | #247 | Tragic $86,589 |
| Immigrants | Sudan | 0.9 /100 | #248 | Tragic $86,109 |
| French American Indians | 0.8 /100 | #249 | Tragic $85,899 |
| Pennsylvania Germans | 0.8 /100 | #250 | Tragic $85,836 |
Demographics Similar to Colville by Householder Income Ages 25 - 44 years
In terms of householder income ages 25 - 44 years, the demographic groups most similar to Colville are Pima ($82,821, a difference of 0.26%), Cajun ($82,393, a difference of 0.26%), Senegalese ($82,852, a difference of 0.30%), Central American Indian ($82,355, a difference of 0.30%), and Guatemalan ($82,331, a difference of 0.33%).
| Demographics | Rating | Rank | Householder Income Ages 25 - 44 years |
| Iroquois | 0.2 /100 | #273 | Tragic $83,682 |
| Marshallese | 0.2 /100 | #274 | Tragic $83,575 |
| Immigrants | Jamaica | 0.2 /100 | #275 | Tragic $83,298 |
| Immigrants | Belize | 0.2 /100 | #276 | Tragic $83,141 |
| Paiute | 0.2 /100 | #277 | Tragic $82,984 |
| Senegalese | 0.2 /100 | #278 | Tragic $82,852 |
| Pima | 0.1 /100 | #279 | Tragic $82,821 |
| Colville | 0.1 /100 | #280 | Tragic $82,604 |
| Cajuns | 0.1 /100 | #281 | Tragic $82,393 |
| Central American Indians | 0.1 /100 | #282 | Tragic $82,355 |
| Guatemalans | 0.1 /100 | #283 | Tragic $82,331 |
| Immigrants | Middle Africa | 0.1 /100 | #284 | Tragic $82,254 |
| Immigrants | Somalia | 0.1 /100 | #285 | Tragic $82,188 |
| Ute | 0.1 /100 | #286 | Tragic $82,166 |
| Immigrants | Latin America | 0.1 /100 | #287 | Tragic $82,166 |