Spaniard vs Colville Householder Income Ages 25 - 44 years
COMPARE
Spaniard
Colville
Householder Income Ages 25 - 44 years
Householder Income Ages 25 - 44 years Comparison
Spaniards
Colville
$93,366
HOUSEHOLDER INCOME AGES 25 - 44 YEARS
34.0/ 100
METRIC RATING
187th/ 347
METRIC RANK
$82,604
HOUSEHOLDER INCOME AGES 25 - 44 YEARS
0.1/ 100
METRIC RATING
280th/ 347
METRIC RANK
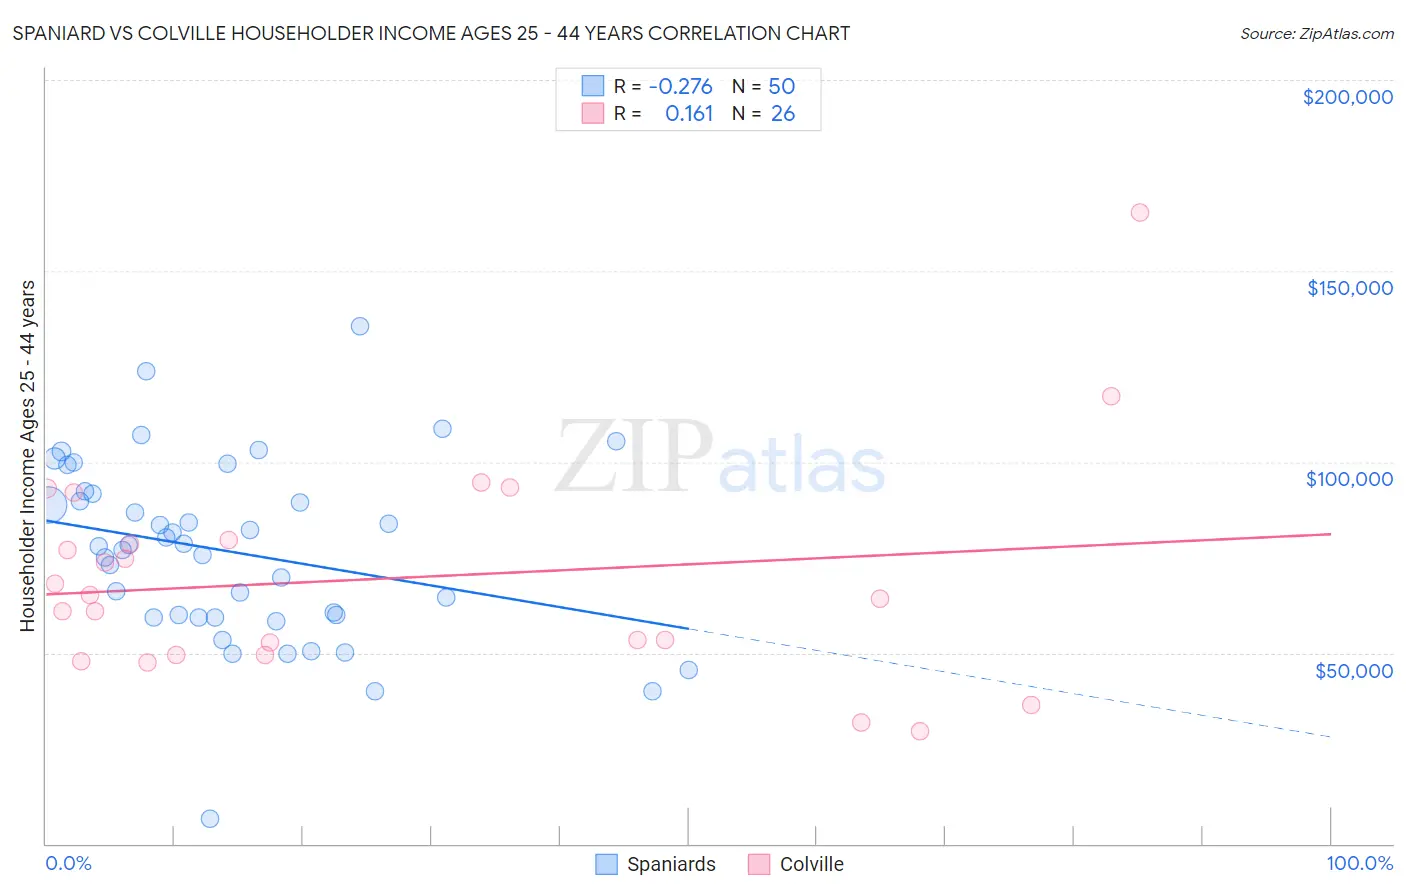
Spaniard vs Colville Householder Income Ages 25 - 44 years Correlation Chart
The statistical analysis conducted on geographies consisting of 441,839,666 people shows a weak negative correlation between the proportion of Spaniards and household income with householder between the ages 25 and 44 in the United States with a correlation coefficient (R) of -0.276 and weighted average of $93,366. Similarly, the statistical analysis conducted on geographies consisting of 34,657,772 people shows a poor positive correlation between the proportion of Colville and household income with householder between the ages 25 and 44 in the United States with a correlation coefficient (R) of 0.161 and weighted average of $82,604, a difference of 13.0%.
Householder Income Ages 25 - 44 years Correlation Summary
| Measurement | Spaniard | Colville |
| Minimum | $6,532 | $29,375 |
| Maximum | $135,588 | $165,278 |
| Range | $129,056 | $135,903 |
| Mean | $76,452 | $69,577 |
| Median | $77,939 | $64,641 |
| Interquartile 25% (IQ1) | $59,278 | $49,583 |
| Interquartile 75% (IQ3) | $91,655 | $79,688 |
| Interquartile Range (IQR) | $32,377 | $30,105 |
| Standard Deviation (Sample) | $23,796 | $28,891 |
| Standard Deviation (Population) | $23,557 | $28,330 |
Similar Demographics by Householder Income Ages 25 - 44 years
Demographics Similar to Spaniards by Householder Income Ages 25 - 44 years
In terms of householder income ages 25 - 44 years, the demographic groups most similar to Spaniards are Sierra Leonean ($93,435, a difference of 0.070%), Immigrants from Eritrea ($93,466, a difference of 0.11%), German ($93,531, a difference of 0.18%), Guamanian/Chamorro ($93,569, a difference of 0.22%), and Immigrants from Sierra Leone ($93,115, a difference of 0.27%).
| Demographics | Rating | Rank | Householder Income Ages 25 - 44 years |
| French | 37.8 /100 | #180 | Fair $93,665 |
| Puget Sound Salish | 37.7 /100 | #181 | Fair $93,661 |
| Uruguayans | 37.3 /100 | #182 | Fair $93,631 |
| Guamanians/Chamorros | 36.5 /100 | #183 | Fair $93,569 |
| Germans | 36.0 /100 | #184 | Fair $93,531 |
| Immigrants | Eritrea | 35.2 /100 | #185 | Fair $93,466 |
| Sierra Leoneans | 34.8 /100 | #186 | Fair $93,435 |
| Spaniards | 34.0 /100 | #187 | Fair $93,366 |
| Immigrants | Sierra Leone | 30.9 /100 | #188 | Fair $93,115 |
| Dutch | 30.5 /100 | #189 | Fair $93,081 |
| Welsh | 30.0 /100 | #190 | Fair $93,039 |
| Tlingit-Haida | 29.4 /100 | #191 | Fair $92,987 |
| Immigrants | Costa Rica | 28.2 /100 | #192 | Fair $92,876 |
| Samoans | 23.0 /100 | #193 | Fair $92,385 |
| Immigrants | Azores | 22.4 /100 | #194 | Fair $92,322 |
Demographics Similar to Colville by Householder Income Ages 25 - 44 years
In terms of householder income ages 25 - 44 years, the demographic groups most similar to Colville are Pima ($82,821, a difference of 0.26%), Cajun ($82,393, a difference of 0.26%), Senegalese ($82,852, a difference of 0.30%), Central American Indian ($82,355, a difference of 0.30%), and Guatemalan ($82,331, a difference of 0.33%).
| Demographics | Rating | Rank | Householder Income Ages 25 - 44 years |
| Iroquois | 0.2 /100 | #273 | Tragic $83,682 |
| Marshallese | 0.2 /100 | #274 | Tragic $83,575 |
| Immigrants | Jamaica | 0.2 /100 | #275 | Tragic $83,298 |
| Immigrants | Belize | 0.2 /100 | #276 | Tragic $83,141 |
| Paiute | 0.2 /100 | #277 | Tragic $82,984 |
| Senegalese | 0.2 /100 | #278 | Tragic $82,852 |
| Pima | 0.1 /100 | #279 | Tragic $82,821 |
| Colville | 0.1 /100 | #280 | Tragic $82,604 |
| Cajuns | 0.1 /100 | #281 | Tragic $82,393 |
| Central American Indians | 0.1 /100 | #282 | Tragic $82,355 |
| Guatemalans | 0.1 /100 | #283 | Tragic $82,331 |
| Immigrants | Middle Africa | 0.1 /100 | #284 | Tragic $82,254 |
| Immigrants | Somalia | 0.1 /100 | #285 | Tragic $82,188 |
| Ute | 0.1 /100 | #286 | Tragic $82,166 |
| Immigrants | Latin America | 0.1 /100 | #287 | Tragic $82,166 |