Immigrants from Sweden vs English Median Household Income
COMPARE
Immigrants from Sweden
English
Median Household Income
Median Household Income Comparison
Immigrants from Sweden
English
$100,699
MEDIAN HOUSEHOLD INCOME
100.0/ 100
METRIC RATING
25th/ 347
METRIC RANK
$84,915
MEDIAN HOUSEHOLD INCOME
47.0/ 100
METRIC RATING
179th/ 347
METRIC RANK
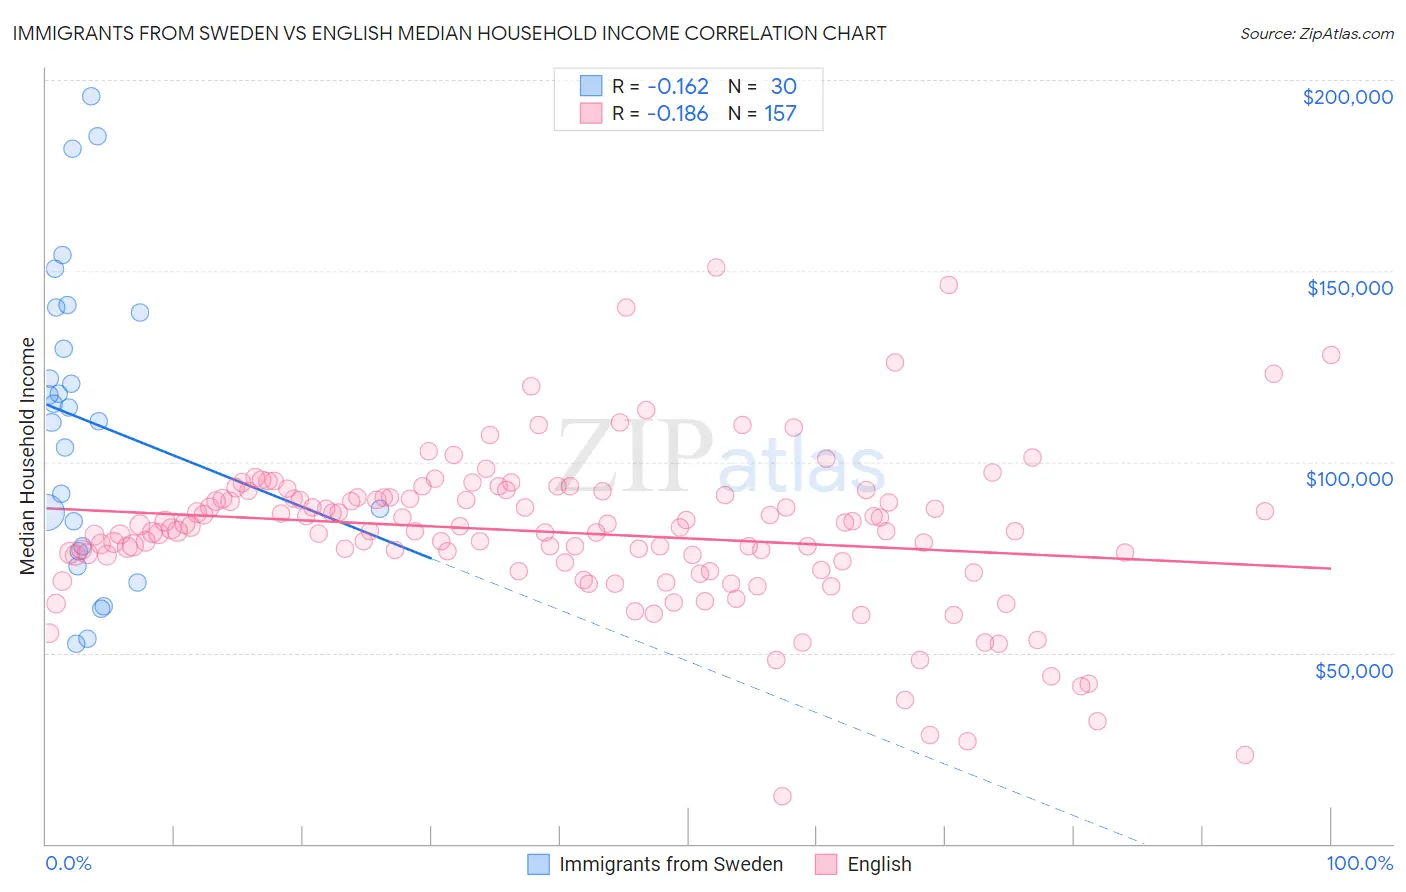
Immigrants from Sweden vs English Median Household Income Correlation Chart
The statistical analysis conducted on geographies consisting of 164,698,337 people shows a poor negative correlation between the proportion of Immigrants from Sweden and median household income in the United States with a correlation coefficient (R) of -0.162 and weighted average of $100,699. Similarly, the statistical analysis conducted on geographies consisting of 578,383,901 people shows a poor negative correlation between the proportion of English and median household income in the United States with a correlation coefficient (R) of -0.186 and weighted average of $84,915, a difference of 18.6%.
Median Household Income Correlation Summary
| Measurement | Immigrants from Sweden | English |
| Minimum | $52,323 | $12,326 |
| Maximum | $195,586 | $150,805 |
| Range | $143,263 | $138,479 |
| Mean | $110,867 | $81,510 |
| Median | $112,526 | $82,609 |
| Interquartile 25% (IQ1) | $78,036 | $73,869 |
| Interquartile 75% (IQ3) | $139,219 | $90,807 |
| Interquartile Range (IQR) | $61,183 | $16,938 |
| Standard Deviation (Sample) | $38,839 | $20,635 |
| Standard Deviation (Population) | $38,186 | $20,569 |
Similar Demographics by Median Household Income
Demographics Similar to Immigrants from Sweden by Median Household Income
In terms of median household income, the demographic groups most similar to Immigrants from Sweden are Immigrants from Japan ($100,711, a difference of 0.010%), Immigrants from Belgium ($100,306, a difference of 0.39%), Bhutanese ($100,151, a difference of 0.55%), Immigrants from Bolivia ($101,394, a difference of 0.69%), and Immigrants from Sri Lanka ($99,943, a difference of 0.76%).
| Demographics | Rating | Rank | Median Household Income |
| Cypriots | 100.0 /100 | #18 | Exceptional $102,843 |
| Immigrants | Australia | 100.0 /100 | #19 | Exceptional $102,562 |
| Bolivians | 100.0 /100 | #20 | Exceptional $102,195 |
| Eastern Europeans | 100.0 /100 | #21 | Exceptional $101,781 |
| Asians | 100.0 /100 | #22 | Exceptional $101,681 |
| Immigrants | Bolivia | 100.0 /100 | #23 | Exceptional $101,394 |
| Immigrants | Japan | 100.0 /100 | #24 | Exceptional $100,711 |
| Immigrants | Sweden | 100.0 /100 | #25 | Exceptional $100,699 |
| Immigrants | Belgium | 100.0 /100 | #26 | Exceptional $100,306 |
| Bhutanese | 100.0 /100 | #27 | Exceptional $100,151 |
| Immigrants | Sri Lanka | 100.0 /100 | #28 | Exceptional $99,943 |
| Immigrants | Asia | 100.0 /100 | #29 | Exceptional $99,933 |
| Immigrants | Northern Europe | 100.0 /100 | #30 | Exceptional $99,813 |
| Turks | 100.0 /100 | #31 | Exceptional $99,389 |
| Immigrants | Denmark | 100.0 /100 | #32 | Exceptional $98,510 |
Demographics Similar to English by Median Household Income
In terms of median household income, the demographic groups most similar to English are Czechoslovakian ($84,965, a difference of 0.060%), Immigrants from Eritrea ($85,025, a difference of 0.13%), Immigrants from Costa Rica ($85,054, a difference of 0.16%), Alsatian ($85,053, a difference of 0.16%), and Immigrants from Portugal ($84,740, a difference of 0.21%).
| Demographics | Rating | Rank | Median Household Income |
| Slovenes | 57.4 /100 | #172 | Average $85,562 |
| Immigrants | Cameroon | 53.4 /100 | #173 | Average $85,314 |
| Scottish | 50.0 /100 | #174 | Average $85,101 |
| Immigrants | Costa Rica | 49.2 /100 | #175 | Average $85,054 |
| Alsatians | 49.2 /100 | #176 | Average $85,053 |
| Immigrants | Eritrea | 48.8 /100 | #177 | Average $85,025 |
| Czechoslovakians | 47.8 /100 | #178 | Average $84,965 |
| English | 47.0 /100 | #179 | Average $84,915 |
| Immigrants | Portugal | 44.2 /100 | #180 | Average $84,740 |
| Hawaiians | 44.1 /100 | #181 | Average $84,729 |
| Uruguayans | 43.5 /100 | #182 | Average $84,691 |
| Spaniards | 42.7 /100 | #183 | Average $84,644 |
| Immigrants | Eastern Africa | 37.4 /100 | #184 | Fair $84,299 |
| Kenyans | 34.2 /100 | #185 | Fair $84,085 |
| Puget Sound Salish | 33.2 /100 | #186 | Fair $84,011 |