Immigrants from Sweden vs Haitian Median Household Income
COMPARE
Immigrants from Sweden
Haitian
Median Household Income
Median Household Income Comparison
Immigrants from Sweden
Haitians
$100,699
MEDIAN HOUSEHOLD INCOME
100.0/ 100
METRIC RATING
25th/ 347
METRIC RANK
$73,306
MEDIAN HOUSEHOLD INCOME
0.1/ 100
METRIC RATING
296th/ 347
METRIC RANK
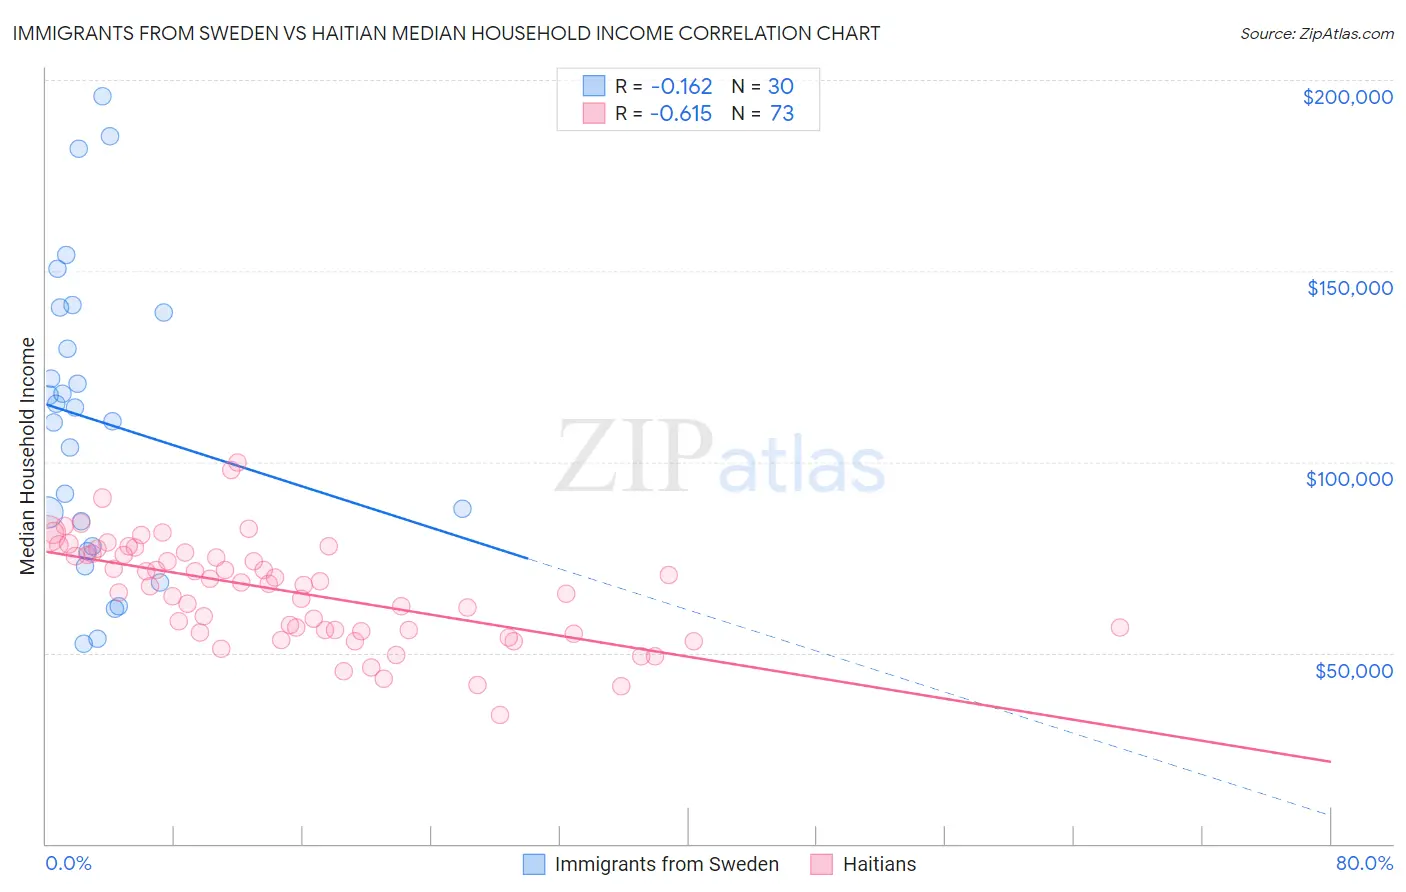
Immigrants from Sweden vs Haitian Median Household Income Correlation Chart
The statistical analysis conducted on geographies consisting of 164,698,337 people shows a poor negative correlation between the proportion of Immigrants from Sweden and median household income in the United States with a correlation coefficient (R) of -0.162 and weighted average of $100,699. Similarly, the statistical analysis conducted on geographies consisting of 287,615,576 people shows a significant negative correlation between the proportion of Haitians and median household income in the United States with a correlation coefficient (R) of -0.615 and weighted average of $73,306, a difference of 37.4%.
Median Household Income Correlation Summary
| Measurement | Immigrants from Sweden | Haitian |
| Minimum | $52,323 | $33,629 |
| Maximum | $195,586 | $99,911 |
| Range | $143,263 | $66,282 |
| Mean | $110,867 | $66,249 |
| Median | $112,526 | $68,171 |
| Interquartile 25% (IQ1) | $78,036 | $55,796 |
| Interquartile 75% (IQ3) | $139,219 | $76,109 |
| Interquartile Range (IQR) | $61,183 | $20,312 |
| Standard Deviation (Sample) | $38,839 | $13,488 |
| Standard Deviation (Population) | $38,186 | $13,395 |
Similar Demographics by Median Household Income
Demographics Similar to Immigrants from Sweden by Median Household Income
In terms of median household income, the demographic groups most similar to Immigrants from Sweden are Immigrants from Japan ($100,711, a difference of 0.010%), Immigrants from Belgium ($100,306, a difference of 0.39%), Bhutanese ($100,151, a difference of 0.55%), Immigrants from Bolivia ($101,394, a difference of 0.69%), and Immigrants from Sri Lanka ($99,943, a difference of 0.76%).
| Demographics | Rating | Rank | Median Household Income |
| Cypriots | 100.0 /100 | #18 | Exceptional $102,843 |
| Immigrants | Australia | 100.0 /100 | #19 | Exceptional $102,562 |
| Bolivians | 100.0 /100 | #20 | Exceptional $102,195 |
| Eastern Europeans | 100.0 /100 | #21 | Exceptional $101,781 |
| Asians | 100.0 /100 | #22 | Exceptional $101,681 |
| Immigrants | Bolivia | 100.0 /100 | #23 | Exceptional $101,394 |
| Immigrants | Japan | 100.0 /100 | #24 | Exceptional $100,711 |
| Immigrants | Sweden | 100.0 /100 | #25 | Exceptional $100,699 |
| Immigrants | Belgium | 100.0 /100 | #26 | Exceptional $100,306 |
| Bhutanese | 100.0 /100 | #27 | Exceptional $100,151 |
| Immigrants | Sri Lanka | 100.0 /100 | #28 | Exceptional $99,943 |
| Immigrants | Asia | 100.0 /100 | #29 | Exceptional $99,933 |
| Immigrants | Northern Europe | 100.0 /100 | #30 | Exceptional $99,813 |
| Turks | 100.0 /100 | #31 | Exceptional $99,389 |
| Immigrants | Denmark | 100.0 /100 | #32 | Exceptional $98,510 |
Demographics Similar to Haitians by Median Household Income
In terms of median household income, the demographic groups most similar to Haitians are Cuban ($73,392, a difference of 0.12%), Immigrants from Mexico ($73,160, a difference of 0.20%), Blackfeet ($73,509, a difference of 0.28%), Immigrants from Cabo Verde ($73,515, a difference of 0.29%), and Paiute ($72,959, a difference of 0.48%).
| Demographics | Rating | Rank | Median Household Income |
| Fijians | 0.1 /100 | #289 | Tragic $74,205 |
| Bangladeshis | 0.1 /100 | #290 | Tragic $74,112 |
| Hispanics or Latinos | 0.1 /100 | #291 | Tragic $73,823 |
| Comanche | 0.1 /100 | #292 | Tragic $73,747 |
| Immigrants | Cabo Verde | 0.1 /100 | #293 | Tragic $73,515 |
| Blackfeet | 0.1 /100 | #294 | Tragic $73,509 |
| Cubans | 0.1 /100 | #295 | Tragic $73,392 |
| Haitians | 0.1 /100 | #296 | Tragic $73,306 |
| Immigrants | Mexico | 0.0 /100 | #297 | Tragic $73,160 |
| Paiute | 0.0 /100 | #298 | Tragic $72,959 |
| Indonesians | 0.0 /100 | #299 | Tragic $72,856 |
| Immigrants | Dominica | 0.0 /100 | #300 | Tragic $72,760 |
| Cherokee | 0.0 /100 | #301 | Tragic $72,682 |
| Shoshone | 0.0 /100 | #302 | Tragic $72,660 |
| Africans | 0.0 /100 | #303 | Tragic $72,650 |