Immigrants from Sweden vs Australian Householder Income Ages 25 - 44 years
COMPARE
Immigrants from Sweden
Australian
Householder Income Ages 25 - 44 years
Householder Income Ages 25 - 44 years Comparison
Immigrants from Sweden
Australians
$112,010
HOUSEHOLDER INCOME AGES 25 - 44 YEARS
100.0/ 100
METRIC RATING
24th/ 347
METRIC RANK
$107,912
HOUSEHOLDER INCOME AGES 25 - 44 YEARS
99.9/ 100
METRIC RATING
42nd/ 347
METRIC RANK
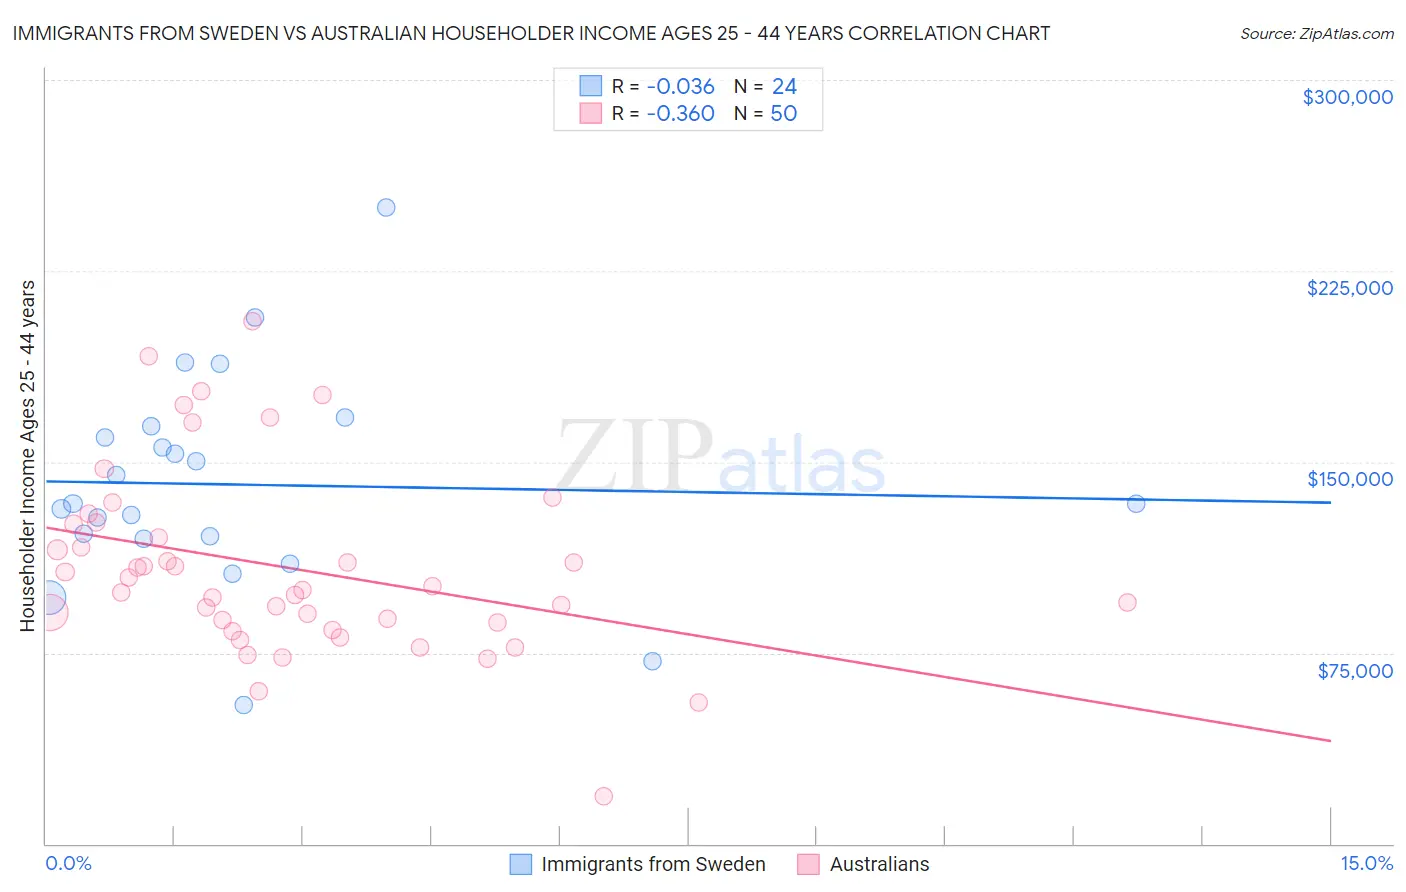
Immigrants from Sweden vs Australian Householder Income Ages 25 - 44 years Correlation Chart
The statistical analysis conducted on geographies consisting of 164,402,876 people shows no correlation between the proportion of Immigrants from Sweden and household income with householder between the ages 25 and 44 in the United States with a correlation coefficient (R) of -0.036 and weighted average of $112,010. Similarly, the statistical analysis conducted on geographies consisting of 223,617,547 people shows a mild negative correlation between the proportion of Australians and household income with householder between the ages 25 and 44 in the United States with a correlation coefficient (R) of -0.360 and weighted average of $107,912, a difference of 3.8%.
Householder Income Ages 25 - 44 years Correlation Summary
| Measurement | Immigrants from Sweden | Australian |
| Minimum | $54,583 | $18,442 |
| Maximum | $250,001 | $205,156 |
| Range | $195,418 | $186,714 |
| Mean | $141,082 | $108,530 |
| Median | $133,512 | $100,349 |
| Interquartile 25% (IQ1) | $120,320 | $86,875 |
| Interquartile 75% (IQ3) | $161,851 | $125,544 |
| Interquartile Range (IQR) | $41,531 | $38,669 |
| Standard Deviation (Sample) | $42,161 | $36,623 |
| Standard Deviation (Population) | $41,274 | $36,255 |
Demographics Similar to Immigrants from Sweden and Australians by Householder Income Ages 25 - 44 years
In terms of householder income ages 25 - 44 years, the demographic groups most similar to Immigrants from Sweden are Immigrants from Japan ($112,228, a difference of 0.19%), Immigrants from Northern Europe ($111,676, a difference of 0.30%), Immigrants from Asia ($110,787, a difference of 1.1%), Russian ($110,398, a difference of 1.5%), and Immigrants from Denmark ($110,363, a difference of 1.5%). Similarly, the demographic groups most similar to Australians are Immigrants from Bolivia ($108,128, a difference of 0.20%), Immigrants from Lithuania ($108,149, a difference of 0.22%), Immigrants from Malaysia ($107,650, a difference of 0.24%), Immigrants from France ($108,257, a difference of 0.32%), and Soviet Union ($108,457, a difference of 0.51%).
| Demographics | Rating | Rank | Householder Income Ages 25 - 44 years |
| Immigrants | Japan | 100.0 /100 | #23 | Exceptional $112,228 |
| Immigrants | Sweden | 100.0 /100 | #24 | Exceptional $112,010 |
| Immigrants | Northern Europe | 100.0 /100 | #25 | Exceptional $111,676 |
| Immigrants | Asia | 100.0 /100 | #26 | Exceptional $110,787 |
| Russians | 100.0 /100 | #27 | Exceptional $110,398 |
| Immigrants | Denmark | 100.0 /100 | #28 | Exceptional $110,363 |
| Turks | 100.0 /100 | #29 | Exceptional $110,318 |
| Immigrants | Greece | 100.0 /100 | #30 | Exceptional $110,103 |
| Maltese | 100.0 /100 | #31 | Exceptional $110,064 |
| Immigrants | Sri Lanka | 100.0 /100 | #32 | Exceptional $109,741 |
| Bhutanese | 100.0 /100 | #33 | Exceptional $109,520 |
| Bolivians | 100.0 /100 | #34 | Exceptional $109,372 |
| Immigrants | Switzerland | 100.0 /100 | #35 | Exceptional $109,185 |
| Latvians | 100.0 /100 | #36 | Exceptional $108,926 |
| Immigrants | Russia | 100.0 /100 | #37 | Exceptional $108,751 |
| Soviet Union | 100.0 /100 | #38 | Exceptional $108,457 |
| Immigrants | France | 99.9 /100 | #39 | Exceptional $108,257 |
| Immigrants | Lithuania | 99.9 /100 | #40 | Exceptional $108,149 |
| Immigrants | Bolivia | 99.9 /100 | #41 | Exceptional $108,128 |
| Australians | 99.9 /100 | #42 | Exceptional $107,912 |
| Immigrants | Malaysia | 99.9 /100 | #43 | Exceptional $107,650 |