Immigrants from Sweden vs Immigrants from Singapore Householder Income Ages 25 - 44 years
COMPARE
Immigrants from Sweden
Immigrants from Singapore
Householder Income Ages 25 - 44 years
Householder Income Ages 25 - 44 years Comparison
Immigrants from Sweden
Immigrants from Singapore
$112,010
HOUSEHOLDER INCOME AGES 25 - 44 YEARS
100.0/ 100
METRIC RATING
24th/ 347
METRIC RANK
$124,429
HOUSEHOLDER INCOME AGES 25 - 44 YEARS
100.0/ 100
METRIC RATING
4th/ 347
METRIC RANK
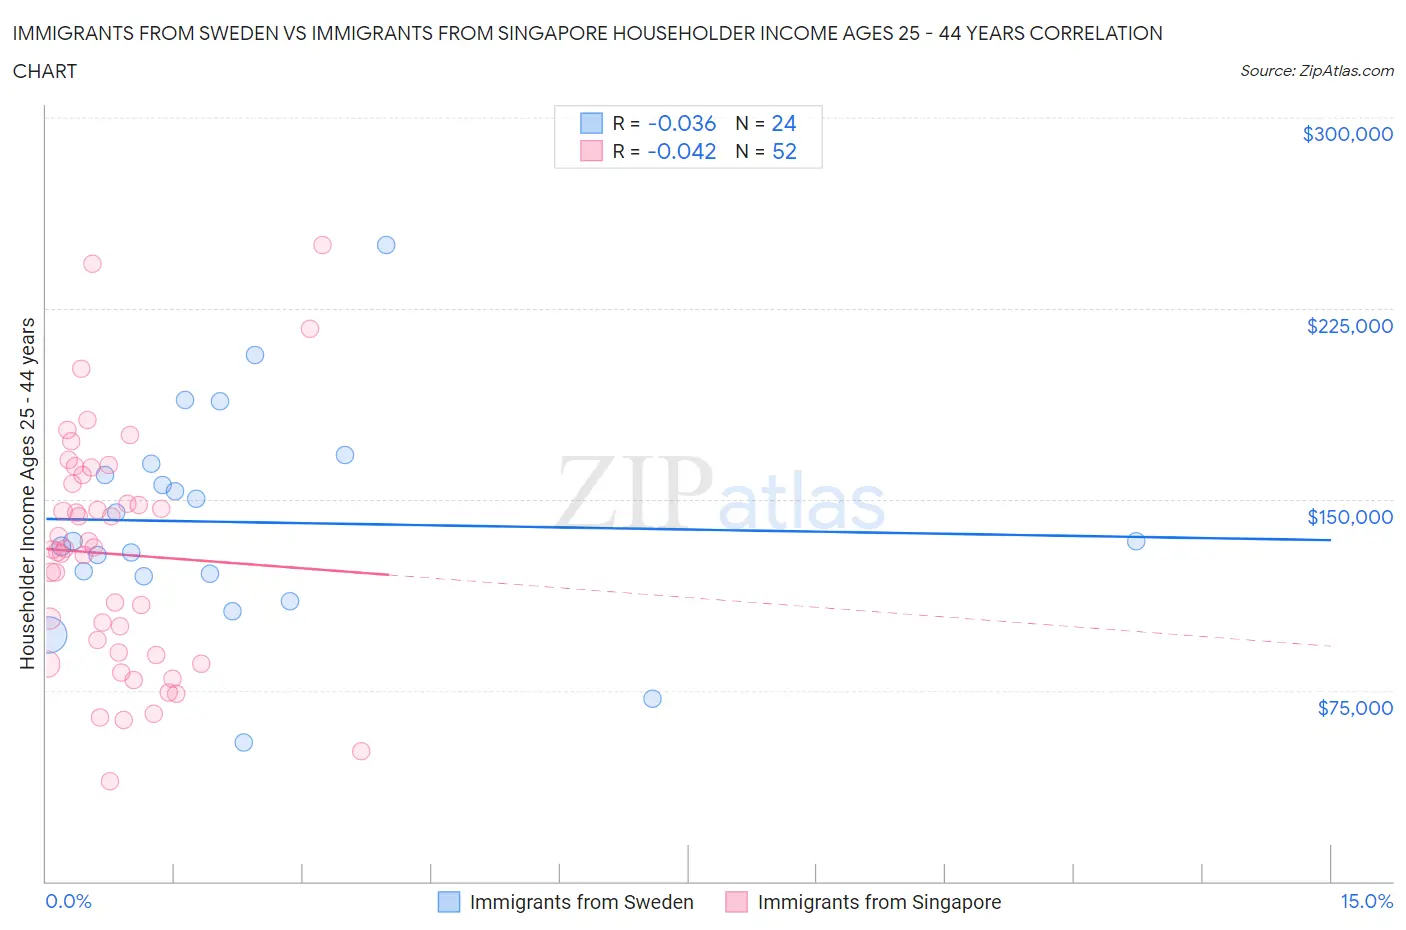
Immigrants from Sweden vs Immigrants from Singapore Householder Income Ages 25 - 44 years Correlation Chart
The statistical analysis conducted on geographies consisting of 164,402,876 people shows no correlation between the proportion of Immigrants from Sweden and household income with householder between the ages 25 and 44 in the United States with a correlation coefficient (R) of -0.036 and weighted average of $112,010. Similarly, the statistical analysis conducted on geographies consisting of 137,346,360 people shows no correlation between the proportion of Immigrants from Singapore and household income with householder between the ages 25 and 44 in the United States with a correlation coefficient (R) of -0.042 and weighted average of $124,429, a difference of 11.1%.
Householder Income Ages 25 - 44 years Correlation Summary
| Measurement | Immigrants from Sweden | Immigrants from Singapore |
| Minimum | $54,583 | $39,441 |
| Maximum | $250,001 | $250,001 |
| Range | $195,418 | $210,560 |
| Mean | $141,082 | $128,508 |
| Median | $133,512 | $130,454 |
| Interquartile 25% (IQ1) | $120,320 | $89,308 |
| Interquartile 75% (IQ3) | $161,851 | $157,929 |
| Interquartile Range (IQR) | $41,531 | $68,620 |
| Standard Deviation (Sample) | $42,161 | $46,353 |
| Standard Deviation (Population) | $41,274 | $45,905 |
Demographics Similar to Immigrants from Sweden and Immigrants from Singapore by Householder Income Ages 25 - 44 years
In terms of householder income ages 25 - 44 years, the demographic groups most similar to Immigrants from Sweden are Immigrants from Japan ($112,228, a difference of 0.19%), Immigrants from Belgium ($112,575, a difference of 0.50%), Asian ($112,666, a difference of 0.59%), Immigrants from Korea ($113,401, a difference of 1.2%), and Burmese ($113,701, a difference of 1.5%). Similarly, the demographic groups most similar to Immigrants from Singapore are Immigrants from India ($124,238, a difference of 0.15%), Thai ($121,778, a difference of 2.2%), Immigrants from Ireland ($120,333, a difference of 3.4%), Iranian ($120,292, a difference of 3.4%), and Immigrants from China ($119,756, a difference of 3.9%).
| Demographics | Rating | Rank | Householder Income Ages 25 - 44 years |
| Immigrants | Singapore | 100.0 /100 | #4 | Exceptional $124,429 |
| Immigrants | India | 100.0 /100 | #5 | Exceptional $124,238 |
| Thais | 100.0 /100 | #6 | Exceptional $121,778 |
| Immigrants | Ireland | 100.0 /100 | #7 | Exceptional $120,333 |
| Iranians | 100.0 /100 | #8 | Exceptional $120,292 |
| Immigrants | China | 100.0 /100 | #9 | Exceptional $119,756 |
| Indians (Asian) | 100.0 /100 | #10 | Exceptional $119,496 |
| Okinawans | 100.0 /100 | #11 | Exceptional $119,349 |
| Immigrants | Iran | 100.0 /100 | #12 | Exceptional $119,204 |
| Immigrants | Eastern Asia | 100.0 /100 | #13 | Exceptional $118,056 |
| Immigrants | Israel | 100.0 /100 | #14 | Exceptional $117,219 |
| Immigrants | South Central Asia | 100.0 /100 | #15 | Exceptional $116,626 |
| Cypriots | 100.0 /100 | #16 | Exceptional $116,364 |
| Immigrants | Australia | 100.0 /100 | #17 | Exceptional $115,947 |
| Eastern Europeans | 100.0 /100 | #18 | Exceptional $114,523 |
| Burmese | 100.0 /100 | #19 | Exceptional $113,701 |
| Immigrants | Korea | 100.0 /100 | #20 | Exceptional $113,401 |
| Asians | 100.0 /100 | #21 | Exceptional $112,666 |
| Immigrants | Belgium | 100.0 /100 | #22 | Exceptional $112,575 |
| Immigrants | Japan | 100.0 /100 | #23 | Exceptional $112,228 |
| Immigrants | Sweden | 100.0 /100 | #24 | Exceptional $112,010 |