Immigrants from Sudan vs West Indian Median Male Earnings
COMPARE
Immigrants from Sudan
West Indian
Median Male Earnings
Median Male Earnings Comparison
Immigrants from Sudan
West Indians
$51,489
MEDIAN MALE EARNINGS
5.0/ 100
METRIC RATING
225th/ 347
METRIC RANK
$50,682
MEDIAN MALE EARNINGS
2.3/ 100
METRIC RATING
240th/ 347
METRIC RANK
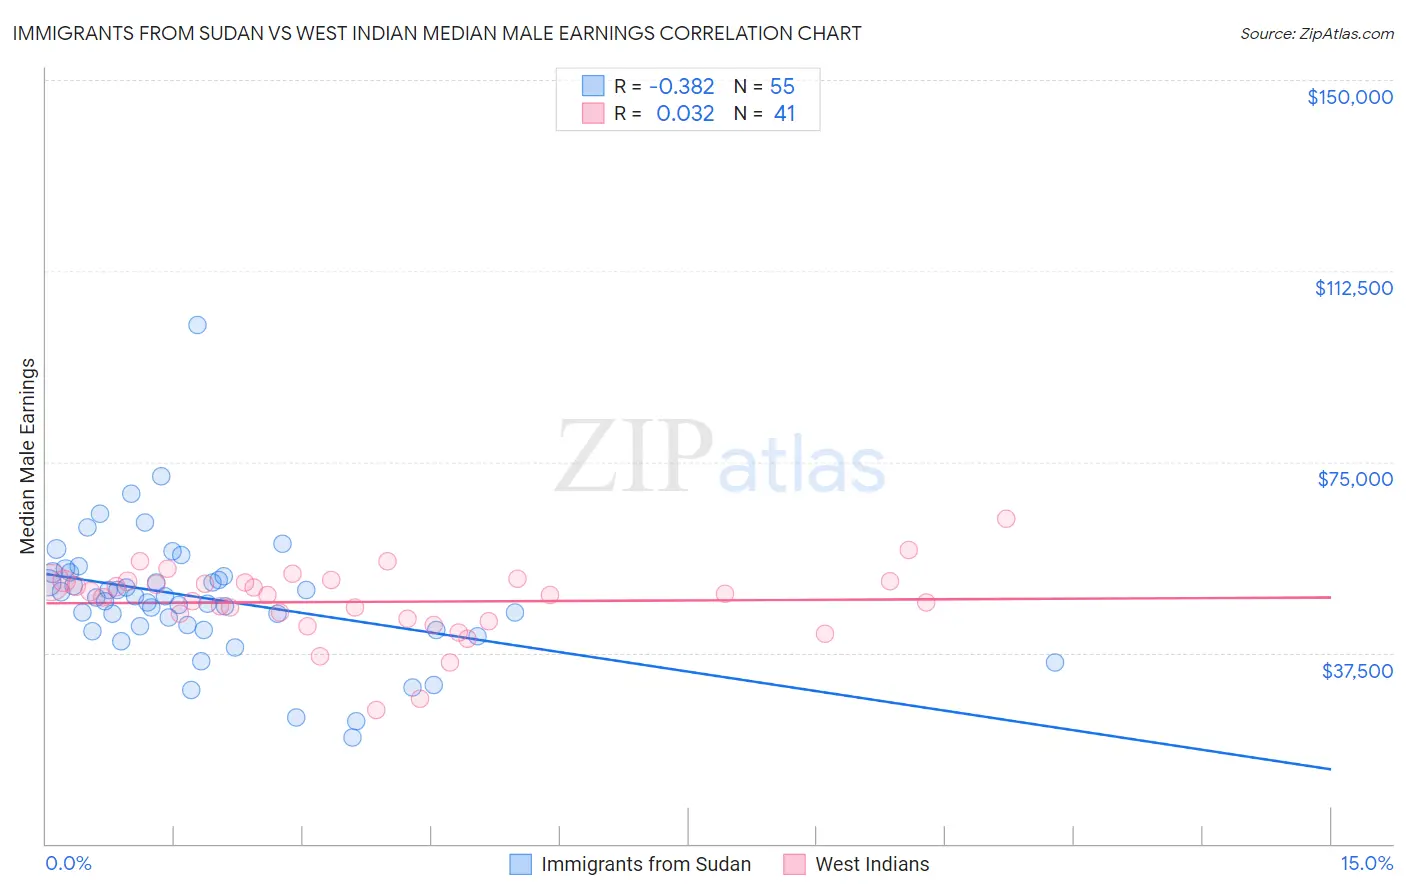
Immigrants from Sudan vs West Indian Median Male Earnings Correlation Chart
The statistical analysis conducted on geographies consisting of 118,955,444 people shows a mild negative correlation between the proportion of Immigrants from Sudan and median male earnings in the United States with a correlation coefficient (R) of -0.382 and weighted average of $51,489. Similarly, the statistical analysis conducted on geographies consisting of 254,015,734 people shows no correlation between the proportion of West Indians and median male earnings in the United States with a correlation coefficient (R) of 0.032 and weighted average of $50,682, a difference of 1.6%.
Median Male Earnings Correlation Summary
| Measurement | Immigrants from Sudan | West Indian |
| Minimum | $20,893 | $26,360 |
| Maximum | $101,789 | $63,750 |
| Range | $80,896 | $37,390 |
| Mean | $48,264 | $47,501 |
| Median | $48,306 | $48,826 |
| Interquartile 25% (IQ1) | $42,060 | $43,884 |
| Interquartile 75% (IQ3) | $53,241 | $51,468 |
| Interquartile Range (IQR) | $11,181 | $7,584 |
| Standard Deviation (Sample) | $12,693 | $7,114 |
| Standard Deviation (Population) | $12,577 | $7,027 |
Demographics Similar to Immigrants from Sudan and West Indians by Median Male Earnings
In terms of median male earnings, the demographic groups most similar to Immigrants from Sudan are Japanese ($51,473, a difference of 0.030%), Trinidadian and Tobagonian ($51,446, a difference of 0.080%), Samoan ($51,389, a difference of 0.19%), Immigrants from Cambodia ($51,594, a difference of 0.20%), and Ecuadorian ($51,596, a difference of 0.21%). Similarly, the demographic groups most similar to West Indians are Immigrants from St. Vincent and the Grenadines ($50,665, a difference of 0.030%), Guyanese ($50,613, a difference of 0.14%), American ($50,761, a difference of 0.16%), Malaysian ($50,772, a difference of 0.18%), and Immigrants from Barbados ($50,795, a difference of 0.22%).
| Demographics | Rating | Rank | Median Male Earnings |
| Immigrants | Bangladesh | 5.8 /100 | #222 | Tragic $51,642 |
| Ecuadorians | 5.5 /100 | #223 | Tragic $51,596 |
| Immigrants | Cambodia | 5.5 /100 | #224 | Tragic $51,594 |
| Immigrants | Sudan | 5.0 /100 | #225 | Tragic $51,489 |
| Japanese | 4.9 /100 | #226 | Tragic $51,473 |
| Trinidadians and Tobagonians | 4.8 /100 | #227 | Tragic $51,446 |
| Samoans | 4.6 /100 | #228 | Tragic $51,389 |
| Immigrants | Trinidad and Tobago | 4.5 /100 | #229 | Tragic $51,376 |
| Immigrants | Nigeria | 4.2 /100 | #230 | Tragic $51,310 |
| Barbadians | 3.9 /100 | #231 | Tragic $51,236 |
| Sudanese | 3.9 /100 | #232 | Tragic $51,216 |
| Aleuts | 3.7 /100 | #233 | Tragic $51,168 |
| Cape Verdeans | 3.5 /100 | #234 | Tragic $51,103 |
| Immigrants | Western Africa | 3.0 /100 | #235 | Tragic $50,940 |
| Pennsylvania Germans | 2.8 /100 | #236 | Tragic $50,878 |
| Immigrants | Barbados | 2.6 /100 | #237 | Tragic $50,795 |
| Malaysians | 2.5 /100 | #238 | Tragic $50,772 |
| Americans | 2.5 /100 | #239 | Tragic $50,761 |
| West Indians | 2.3 /100 | #240 | Tragic $50,682 |
| Immigrants | St. Vincent and the Grenadines | 2.3 /100 | #241 | Tragic $50,665 |
| Guyanese | 2.2 /100 | #242 | Tragic $50,613 |