Immigrants from St. Vincent and the Grenadines vs Celtic Median Earnings
COMPARE
Immigrants from St. Vincent and the Grenadines
Celtic
Median Earnings
Median Earnings Comparison
Immigrants from St. Vincent and the Grenadines
Celtics
$45,908
MEDIAN EARNINGS
32.4/ 100
METRIC RATING
195th/ 347
METRIC RANK
$45,732
MEDIAN EARNINGS
27.2/ 100
METRIC RATING
201st/ 347
METRIC RANK
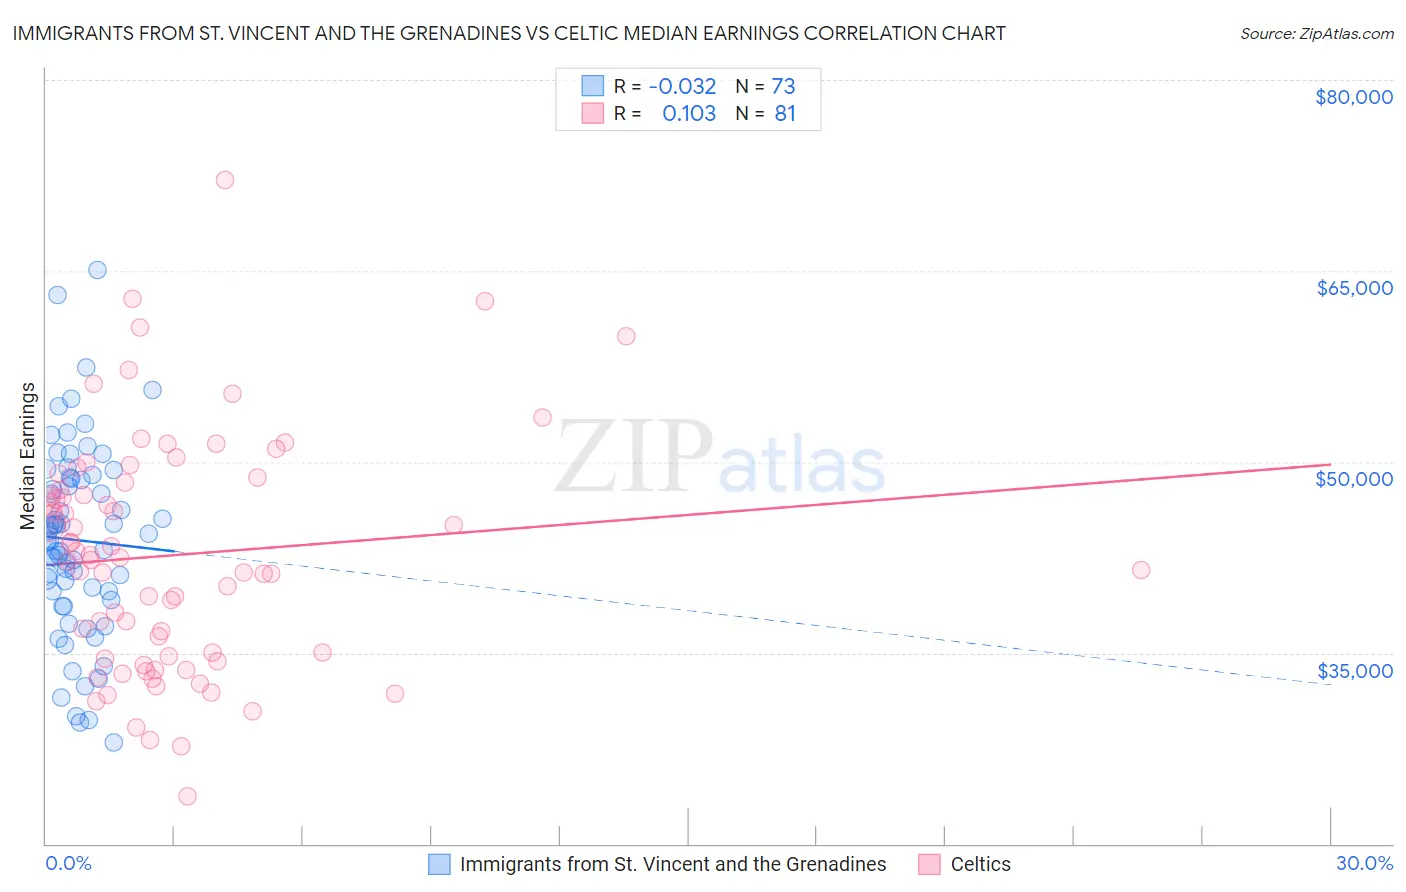
Immigrants from St. Vincent and the Grenadines vs Celtic Median Earnings Correlation Chart
The statistical analysis conducted on geographies consisting of 56,194,678 people shows no correlation between the proportion of Immigrants from St. Vincent and the Grenadines and median earnings in the United States with a correlation coefficient (R) of -0.032 and weighted average of $45,908. Similarly, the statistical analysis conducted on geographies consisting of 168,867,558 people shows a poor positive correlation between the proportion of Celtics and median earnings in the United States with a correlation coefficient (R) of 0.103 and weighted average of $45,732, a difference of 0.39%.
Median Earnings Correlation Summary
| Measurement | Immigrants from St. Vincent and the Grenadines | Celtic |
| Minimum | $27,951 | $23,710 |
| Maximum | $65,069 | $72,162 |
| Range | $37,118 | $48,452 |
| Mean | $43,851 | $42,685 |
| Median | $43,770 | $42,318 |
| Interquartile 25% (IQ1) | $39,492 | $34,608 |
| Interquartile 75% (IQ3) | $48,733 | $48,561 |
| Interquartile Range (IQR) | $9,241 | $13,953 |
| Standard Deviation (Sample) | $7,478 | $9,238 |
| Standard Deviation (Population) | $7,427 | $9,181 |
Demographics Similar to Immigrants from St. Vincent and the Grenadines and Celtics by Median Earnings
In terms of median earnings, the demographic groups most similar to Immigrants from St. Vincent and the Grenadines are Immigrants from Costa Rica ($45,928, a difference of 0.040%), German ($45,935, a difference of 0.060%), Guamanian/Chamorro ($45,933, a difference of 0.060%), Finnish ($45,940, a difference of 0.070%), and Yugoslavian ($45,846, a difference of 0.13%). Similarly, the demographic groups most similar to Celtics are Immigrants from Trinidad and Tobago ($45,729, a difference of 0.010%), Welsh ($45,710, a difference of 0.050%), Immigrants from Uruguay ($45,682, a difference of 0.11%), Tongan ($45,665, a difference of 0.15%), and Immigrants from Barbados ($45,816, a difference of 0.18%).
| Demographics | Rating | Rank | Median Earnings |
| Immigrants | Armenia | 38.3 /100 | #188 | Fair $46,094 |
| Spaniards | 37.2 /100 | #189 | Fair $46,059 |
| French Canadians | 36.1 /100 | #190 | Fair $46,026 |
| Finns | 33.4 /100 | #191 | Fair $45,940 |
| Germans | 33.2 /100 | #192 | Fair $45,935 |
| Guamanians/Chamorros | 33.2 /100 | #193 | Fair $45,933 |
| Immigrants | Costa Rica | 33.0 /100 | #194 | Fair $45,928 |
| Immigrants | St. Vincent and the Grenadines | 32.4 /100 | #195 | Fair $45,908 |
| Yugoslavians | 30.5 /100 | #196 | Fair $45,846 |
| Barbadians | 30.5 /100 | #197 | Fair $45,846 |
| Trinidadians and Tobagonians | 29.7 /100 | #198 | Fair $45,820 |
| Immigrants | Barbados | 29.6 /100 | #199 | Fair $45,816 |
| Immigrants | Azores | 29.5 /100 | #200 | Fair $45,812 |
| Celtics | 27.2 /100 | #201 | Fair $45,732 |
| Immigrants | Trinidad and Tobago | 27.1 /100 | #202 | Fair $45,729 |
| Welsh | 26.6 /100 | #203 | Fair $45,710 |
| Immigrants | Uruguay | 25.9 /100 | #204 | Fair $45,682 |
| Tongans | 25.4 /100 | #205 | Fair $45,665 |
| Immigrants | Ghana | 24.8 /100 | #206 | Fair $45,641 |
| Immigrants | Senegal | 24.0 /100 | #207 | Fair $45,611 |
| Immigrants | Bosnia and Herzegovina | 23.7 /100 | #208 | Fair $45,600 |