Immigrants from St. Vincent and the Grenadines vs Immigrants from Romania Median Earnings
COMPARE
Immigrants from St. Vincent and the Grenadines
Immigrants from Romania
Median Earnings
Median Earnings Comparison
Immigrants from St. Vincent and the Grenadines
Immigrants from Romania
$45,908
MEDIAN EARNINGS
32.4/ 100
METRIC RATING
195th/ 347
METRIC RANK
$51,337
MEDIAN EARNINGS
99.9/ 100
METRIC RATING
62nd/ 347
METRIC RANK
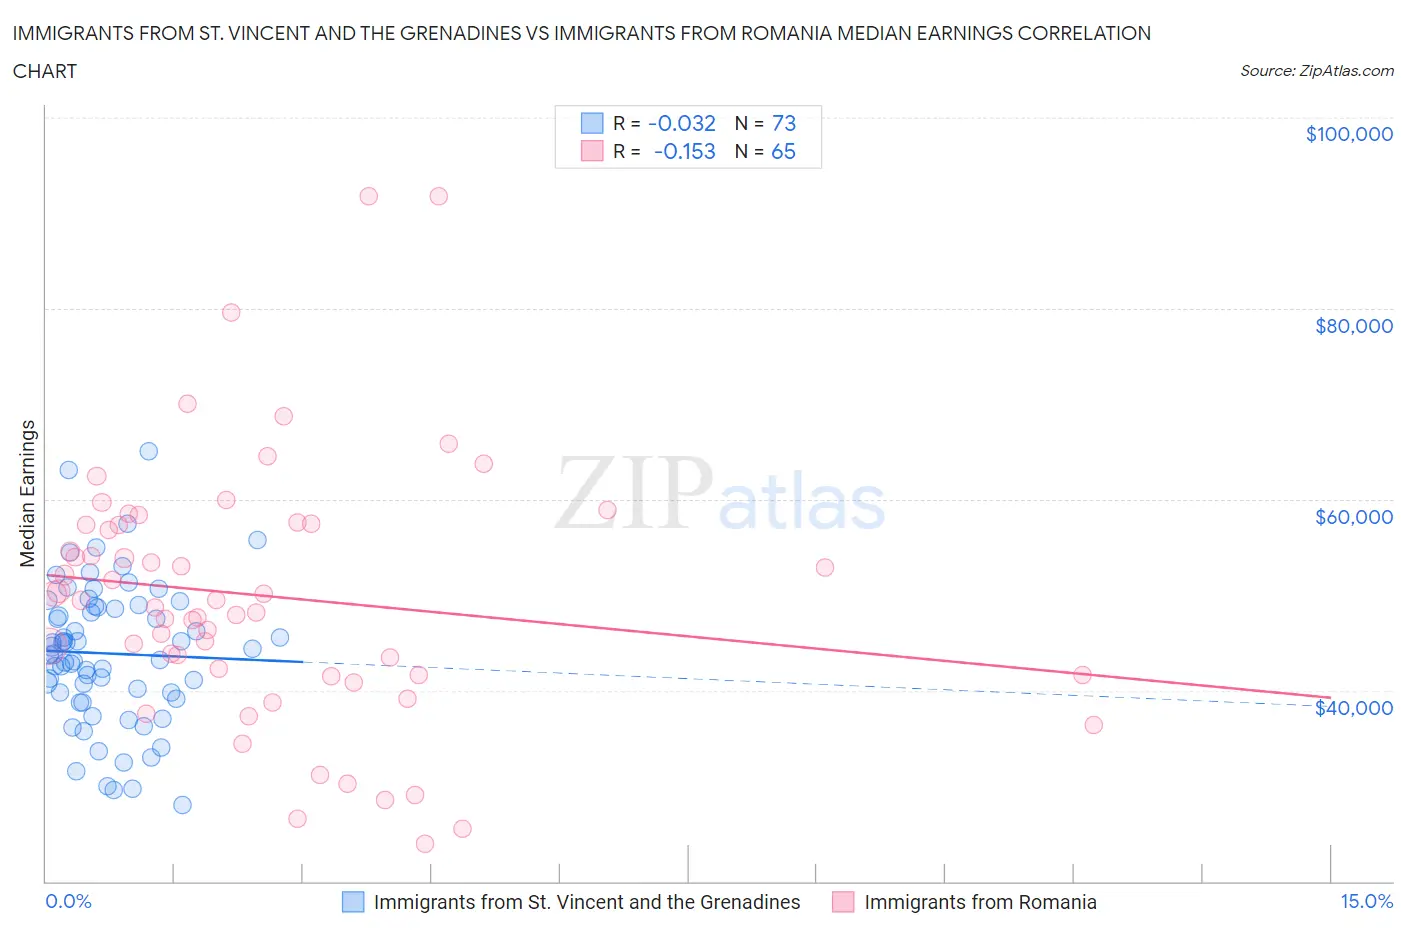
Immigrants from St. Vincent and the Grenadines vs Immigrants from Romania Median Earnings Correlation Chart
The statistical analysis conducted on geographies consisting of 56,194,678 people shows no correlation between the proportion of Immigrants from St. Vincent and the Grenadines and median earnings in the United States with a correlation coefficient (R) of -0.032 and weighted average of $45,908. Similarly, the statistical analysis conducted on geographies consisting of 257,003,110 people shows a poor negative correlation between the proportion of Immigrants from Romania and median earnings in the United States with a correlation coefficient (R) of -0.153 and weighted average of $51,337, a difference of 11.8%.
Median Earnings Correlation Summary
| Measurement | Immigrants from St. Vincent and the Grenadines | Immigrants from Romania |
| Minimum | $27,951 | $23,864 |
| Maximum | $65,069 | $91,786 |
| Range | $37,118 | $67,922 |
| Mean | $43,851 | $49,856 |
| Median | $43,770 | $49,415 |
| Interquartile 25% (IQ1) | $39,492 | $41,640 |
| Interquartile 75% (IQ3) | $48,733 | $57,433 |
| Interquartile Range (IQR) | $9,241 | $15,793 |
| Standard Deviation (Sample) | $7,478 | $13,572 |
| Standard Deviation (Population) | $7,427 | $13,467 |
Similar Demographics by Median Earnings
Demographics Similar to Immigrants from St. Vincent and the Grenadines by Median Earnings
In terms of median earnings, the demographic groups most similar to Immigrants from St. Vincent and the Grenadines are Immigrants from Costa Rica ($45,928, a difference of 0.040%), German ($45,935, a difference of 0.060%), Guamanian/Chamorro ($45,933, a difference of 0.060%), Finnish ($45,940, a difference of 0.070%), and Yugoslavian ($45,846, a difference of 0.13%).
| Demographics | Rating | Rank | Median Earnings |
| Immigrants | Armenia | 38.3 /100 | #188 | Fair $46,094 |
| Spaniards | 37.2 /100 | #189 | Fair $46,059 |
| French Canadians | 36.1 /100 | #190 | Fair $46,026 |
| Finns | 33.4 /100 | #191 | Fair $45,940 |
| Germans | 33.2 /100 | #192 | Fair $45,935 |
| Guamanians/Chamorros | 33.2 /100 | #193 | Fair $45,933 |
| Immigrants | Costa Rica | 33.0 /100 | #194 | Fair $45,928 |
| Immigrants | St. Vincent and the Grenadines | 32.4 /100 | #195 | Fair $45,908 |
| Yugoslavians | 30.5 /100 | #196 | Fair $45,846 |
| Barbadians | 30.5 /100 | #197 | Fair $45,846 |
| Trinidadians and Tobagonians | 29.7 /100 | #198 | Fair $45,820 |
| Immigrants | Barbados | 29.6 /100 | #199 | Fair $45,816 |
| Immigrants | Azores | 29.5 /100 | #200 | Fair $45,812 |
| Celtics | 27.2 /100 | #201 | Fair $45,732 |
| Immigrants | Trinidad and Tobago | 27.1 /100 | #202 | Fair $45,729 |
Demographics Similar to Immigrants from Romania by Median Earnings
In terms of median earnings, the demographic groups most similar to Immigrants from Romania are Immigrants from Bulgaria ($51,318, a difference of 0.040%), New Zealander ($51,246, a difference of 0.18%), Greek ($51,164, a difference of 0.34%), Immigrants from Latvia ($51,555, a difference of 0.42%), and Immigrants from Serbia ($51,557, a difference of 0.43%).
| Demographics | Rating | Rank | Median Earnings |
| Egyptians | 99.9 /100 | #55 | Exceptional $51,701 |
| Immigrants | Pakistan | 99.9 /100 | #56 | Exceptional $51,693 |
| Immigrants | Eastern Europe | 99.9 /100 | #57 | Exceptional $51,624 |
| Immigrants | Bolivia | 99.9 /100 | #58 | Exceptional $51,605 |
| Immigrants | Croatia | 99.9 /100 | #59 | Exceptional $51,581 |
| Immigrants | Serbia | 99.9 /100 | #60 | Exceptional $51,557 |
| Immigrants | Latvia | 99.9 /100 | #61 | Exceptional $51,555 |
| Immigrants | Romania | 99.9 /100 | #62 | Exceptional $51,337 |
| Immigrants | Bulgaria | 99.9 /100 | #63 | Exceptional $51,318 |
| New Zealanders | 99.9 /100 | #64 | Exceptional $51,246 |
| Greeks | 99.9 /100 | #65 | Exceptional $51,164 |
| Afghans | 99.9 /100 | #66 | Exceptional $51,112 |
| Immigrants | Spain | 99.9 /100 | #67 | Exceptional $51,092 |
| Paraguayans | 99.9 /100 | #68 | Exceptional $51,068 |
| Mongolians | 99.8 /100 | #69 | Exceptional $51,038 |