Immigrants from St. Vincent and the Grenadines vs Malaysian Median Family Income
COMPARE
Immigrants from St. Vincent and the Grenadines
Malaysian
Median Family Income
Median Family Income Comparison
Immigrants from St. Vincent and the Grenadines
Malaysians
$90,094
MEDIAN FAMILY INCOME
0.2/ 100
METRIC RATING
275th/ 347
METRIC RANK
$95,230
MEDIAN FAMILY INCOME
2.2/ 100
METRIC RATING
230th/ 347
METRIC RANK
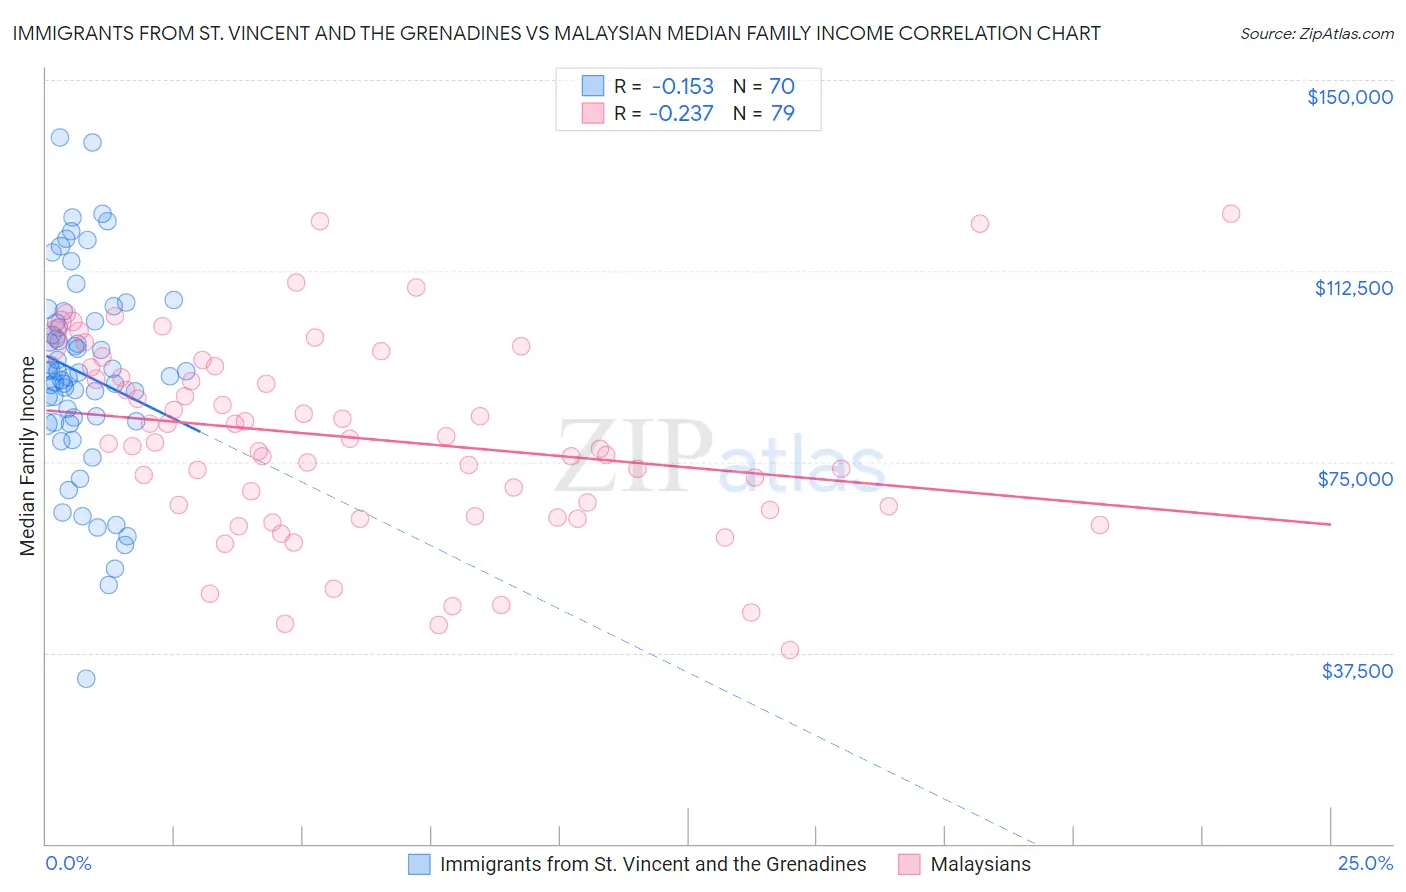
Immigrants from St. Vincent and the Grenadines vs Malaysian Median Family Income Correlation Chart
The statistical analysis conducted on geographies consisting of 56,186,074 people shows a poor negative correlation between the proportion of Immigrants from St. Vincent and the Grenadines and median family income in the United States with a correlation coefficient (R) of -0.153 and weighted average of $90,094. Similarly, the statistical analysis conducted on geographies consisting of 225,953,352 people shows a weak negative correlation between the proportion of Malaysians and median family income in the United States with a correlation coefficient (R) of -0.237 and weighted average of $95,230, a difference of 5.7%.
Median Family Income Correlation Summary
| Measurement | Immigrants from St. Vincent and the Grenadines | Malaysian |
| Minimum | $32,289 | $38,021 |
| Maximum | $138,717 | $123,750 |
| Range | $106,428 | $85,729 |
| Mean | $92,358 | $79,701 |
| Median | $92,624 | $78,842 |
| Interquartile 25% (IQ1) | $82,866 | $65,625 |
| Interquartile 75% (IQ3) | $102,687 | $93,739 |
| Interquartile Range (IQR) | $19,821 | $28,114 |
| Standard Deviation (Sample) | $19,859 | $19,147 |
| Standard Deviation (Population) | $19,717 | $19,025 |
Similar Demographics by Median Family Income
Demographics Similar to Immigrants from St. Vincent and the Grenadines by Median Family Income
In terms of median family income, the demographic groups most similar to Immigrants from St. Vincent and the Grenadines are Spanish American ($90,322, a difference of 0.25%), Immigrants from Micronesia ($90,345, a difference of 0.28%), Immigrants from Liberia ($90,450, a difference of 0.40%), Iroquois ($90,543, a difference of 0.50%), and Jamaican ($90,581, a difference of 0.54%).
| Demographics | Rating | Rank | Median Family Income |
| Cree | 0.2 /100 | #268 | Tragic $90,882 |
| Belizeans | 0.2 /100 | #269 | Tragic $90,880 |
| Jamaicans | 0.2 /100 | #270 | Tragic $90,581 |
| Iroquois | 0.2 /100 | #271 | Tragic $90,543 |
| Immigrants | Liberia | 0.2 /100 | #272 | Tragic $90,450 |
| Immigrants | Micronesia | 0.2 /100 | #273 | Tragic $90,345 |
| Spanish Americans | 0.2 /100 | #274 | Tragic $90,322 |
| Immigrants | St. Vincent and the Grenadines | 0.2 /100 | #275 | Tragic $90,094 |
| Immigrants | Zaire | 0.1 /100 | #276 | Tragic $89,285 |
| Immigrants | Jamaica | 0.1 /100 | #277 | Tragic $89,268 |
| Immigrants | Grenada | 0.1 /100 | #278 | Tragic $89,249 |
| Immigrants | Belize | 0.1 /100 | #279 | Tragic $89,197 |
| British West Indians | 0.1 /100 | #280 | Tragic $88,987 |
| Blackfeet | 0.1 /100 | #281 | Tragic $88,717 |
| Comanche | 0.1 /100 | #282 | Tragic $88,556 |
Demographics Similar to Malaysians by Median Family Income
In terms of median family income, the demographic groups most similar to Malaysians are Marshallese ($95,293, a difference of 0.070%), Ecuadorian ($95,114, a difference of 0.12%), Immigrants from the Azores ($95,402, a difference of 0.18%), Immigrants from Venezuela ($94,904, a difference of 0.34%), and Alaska Native ($95,573, a difference of 0.36%).
| Demographics | Rating | Rank | Median Family Income |
| Venezuelans | 3.7 /100 | #223 | Tragic $96,281 |
| Immigrants | Nonimmigrants | 3.6 /100 | #224 | Tragic $96,231 |
| Vietnamese | 3.4 /100 | #225 | Tragic $96,123 |
| Immigrants | Panama | 2.7 /100 | #226 | Tragic $95,647 |
| Alaska Natives | 2.6 /100 | #227 | Tragic $95,573 |
| Immigrants | Azores | 2.4 /100 | #228 | Tragic $95,402 |
| Marshallese | 2.2 /100 | #229 | Tragic $95,293 |
| Malaysians | 2.2 /100 | #230 | Tragic $95,230 |
| Ecuadorians | 2.1 /100 | #231 | Tragic $95,114 |
| Immigrants | Venezuela | 1.9 /100 | #232 | Tragic $94,904 |
| Immigrants | Bangladesh | 1.6 /100 | #233 | Tragic $94,665 |
| Immigrants | Western Africa | 1.6 /100 | #234 | Tragic $94,638 |
| Immigrants | Burma/Myanmar | 1.5 /100 | #235 | Tragic $94,472 |
| Trinidadians and Tobagonians | 1.5 /100 | #236 | Tragic $94,466 |
| Alaskan Athabascans | 1.5 /100 | #237 | Tragic $94,429 |